Fig. 8.
Download original image
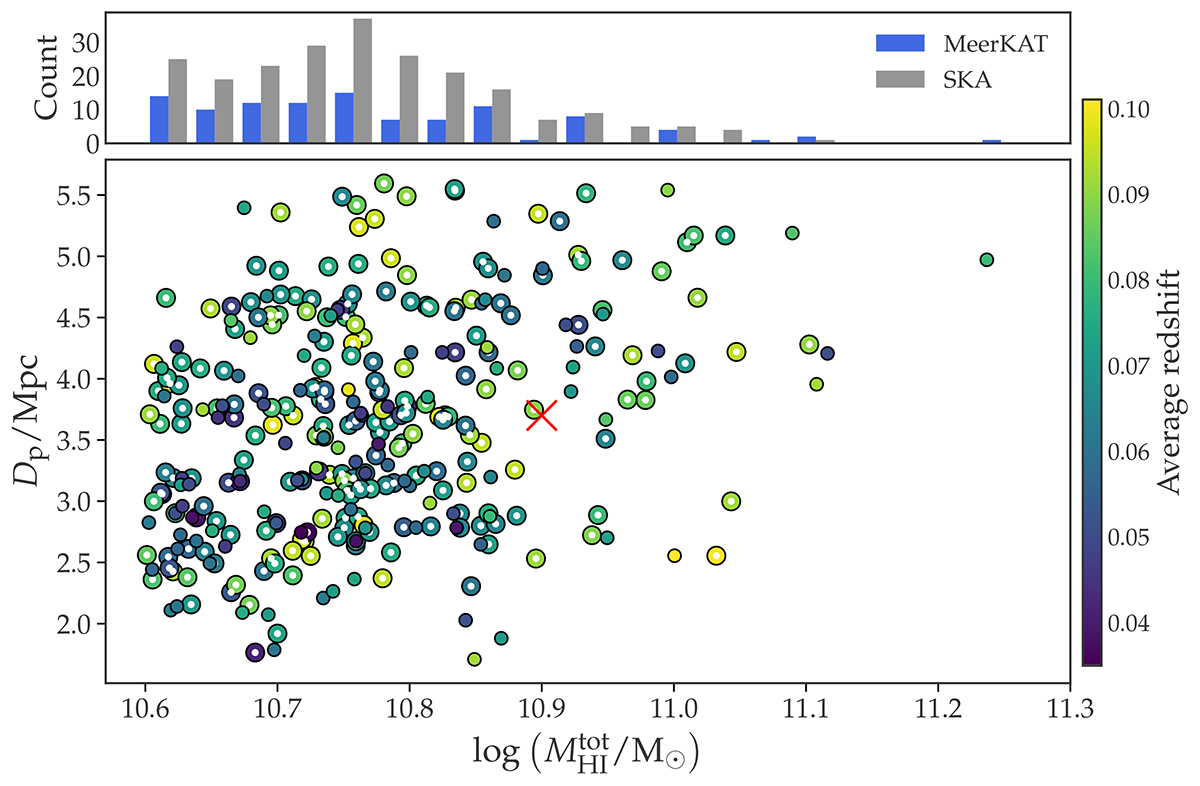
Scatter plot of detectable SIMBA analogous structures found within 300 light cone realisations. Here, the projected distance between furthest group members, Dp, is plotted as a function of total group H I mass, ![]() . Open circles represent SKA-mid-detectable groups, while solid circles represent MeerKAT-detectable groups. All markers are colourised by the mean redshift of the galaxies within the group. The red cross shows the position of the MeerKAT observational structure detected in this work. A histogram is displayed above the plot showing the number of analogues detectable by SKA and MeerKAT for mass bins of 0.035 dex.
. Open circles represent SKA-mid-detectable groups, while solid circles represent MeerKAT-detectable groups. All markers are colourised by the mean redshift of the galaxies within the group. The red cross shows the position of the MeerKAT observational structure detected in this work. A histogram is displayed above the plot showing the number of analogues detectable by SKA and MeerKAT for mass bins of 0.035 dex.
Current usage metrics show cumulative count of Article Views (full-text article views including HTML views, PDF and ePub downloads, according to the available data) and Abstracts Views on Vision4Press platform.
Data correspond to usage on the plateform after 2015. The current usage metrics is available 48-96 hours after online publication and is updated daily on week days.
Initial download of the metrics may take a while.