Fig. C.1
Download original image
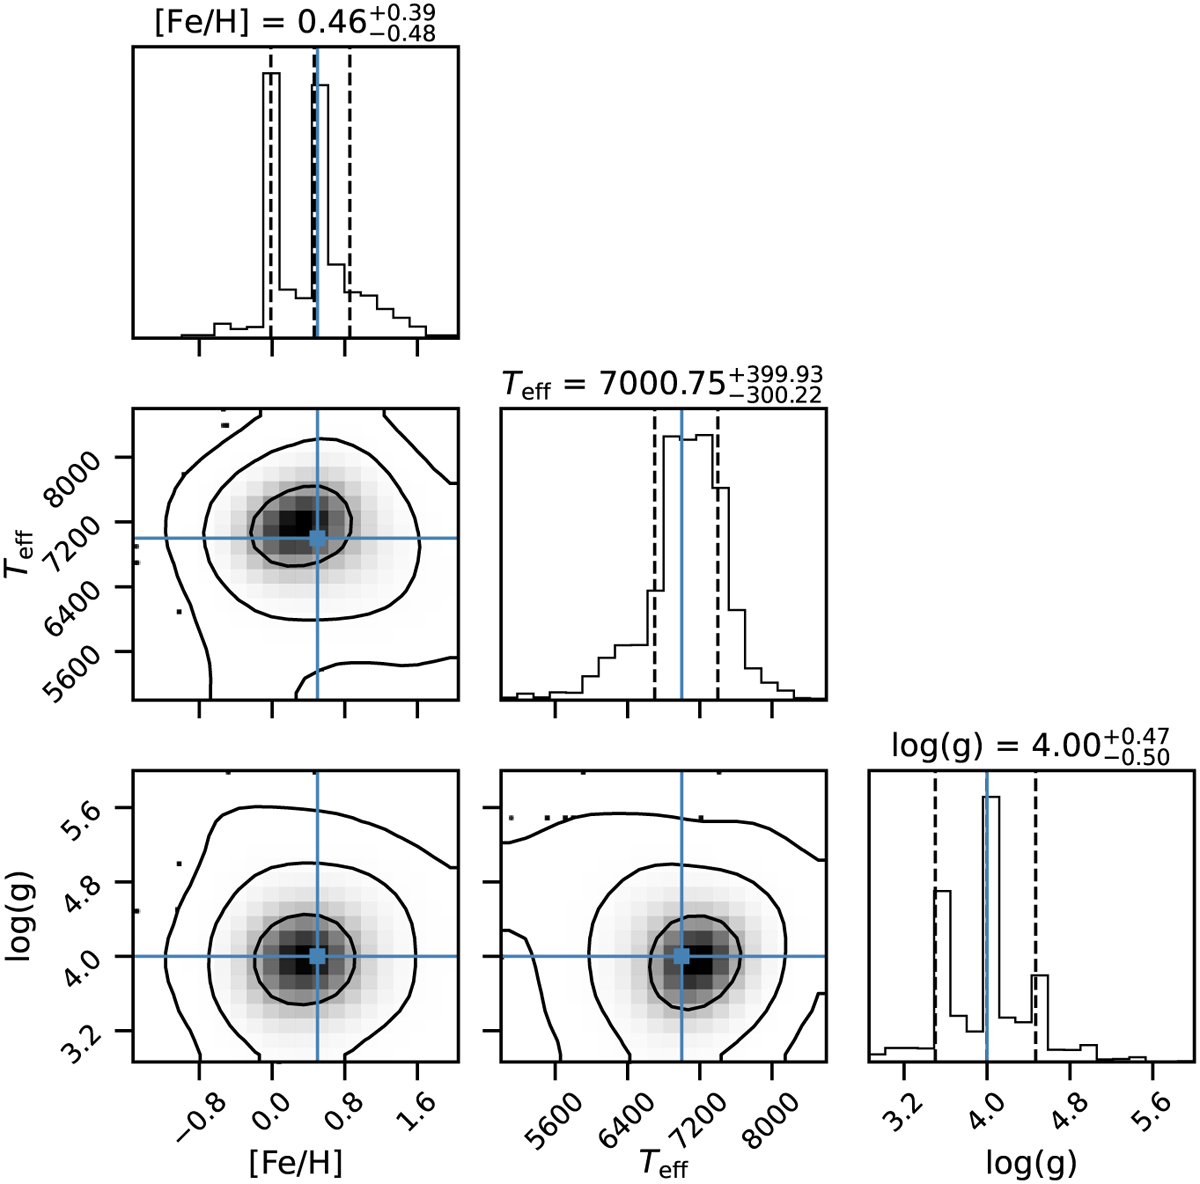
Corner plot showing the one and two smoothed dimensional projection of the posterior probability distribution of Teff, log(g) and [Fe/H]. The initial positions are drawn with a vertical solid blue line and a blue square respectively in the 1D and 2D projections. Vertical dashed lines in the diagonal histograms mark the 16%, 50% and 84% percentiles. The solid line contours in the 2D projections are drawn at 68% (1σ), 95% (2σ), and 99% (3σ) confidence levels.
Current usage metrics show cumulative count of Article Views (full-text article views including HTML views, PDF and ePub downloads, according to the available data) and Abstracts Views on Vision4Press platform.
Data correspond to usage on the plateform after 2015. The current usage metrics is available 48-96 hours after online publication and is updated daily on week days.
Initial download of the metrics may take a while.