Fig. E.1
Download original image
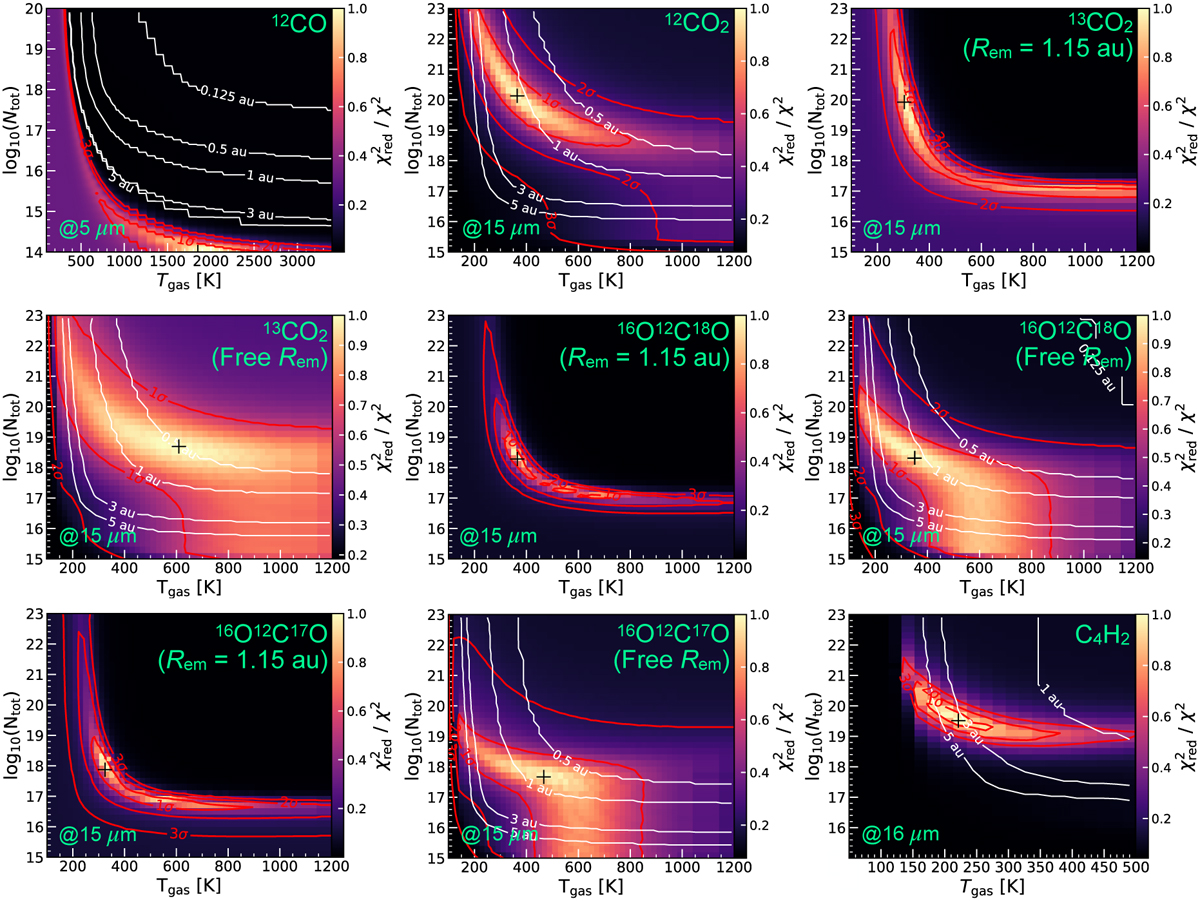
Reduced chi-square Ntot−Tgas maps resulting from the fitting of 0D LTE gas slab models to the MIRI MRS spectrum for various molecular species at increasing wavelength. The fit of the carbon dioxide isotopologues, 13CO2, 16O12C18O, and 16O12C17O with fixed/free emitting radius are labeled in figure. In colorbar are the ![]() /χ2 values, with 1.0 corresponding to the best-fit model. The white contours show the range of fit emitting radii in au, while the red contours show the 1σ, 2σ, and 3σ confidence intervals. The location of the best-fit models in the parameter space is indicated by a black cross marker.
/χ2 values, with 1.0 corresponding to the best-fit model. The white contours show the range of fit emitting radii in au, while the red contours show the 1σ, 2σ, and 3σ confidence intervals. The location of the best-fit models in the parameter space is indicated by a black cross marker.
Current usage metrics show cumulative count of Article Views (full-text article views including HTML views, PDF and ePub downloads, according to the available data) and Abstracts Views on Vision4Press platform.
Data correspond to usage on the plateform after 2015. The current usage metrics is available 48-96 hours after online publication and is updated daily on week days.
Initial download of the metrics may take a while.