Fig. 3
Download original image
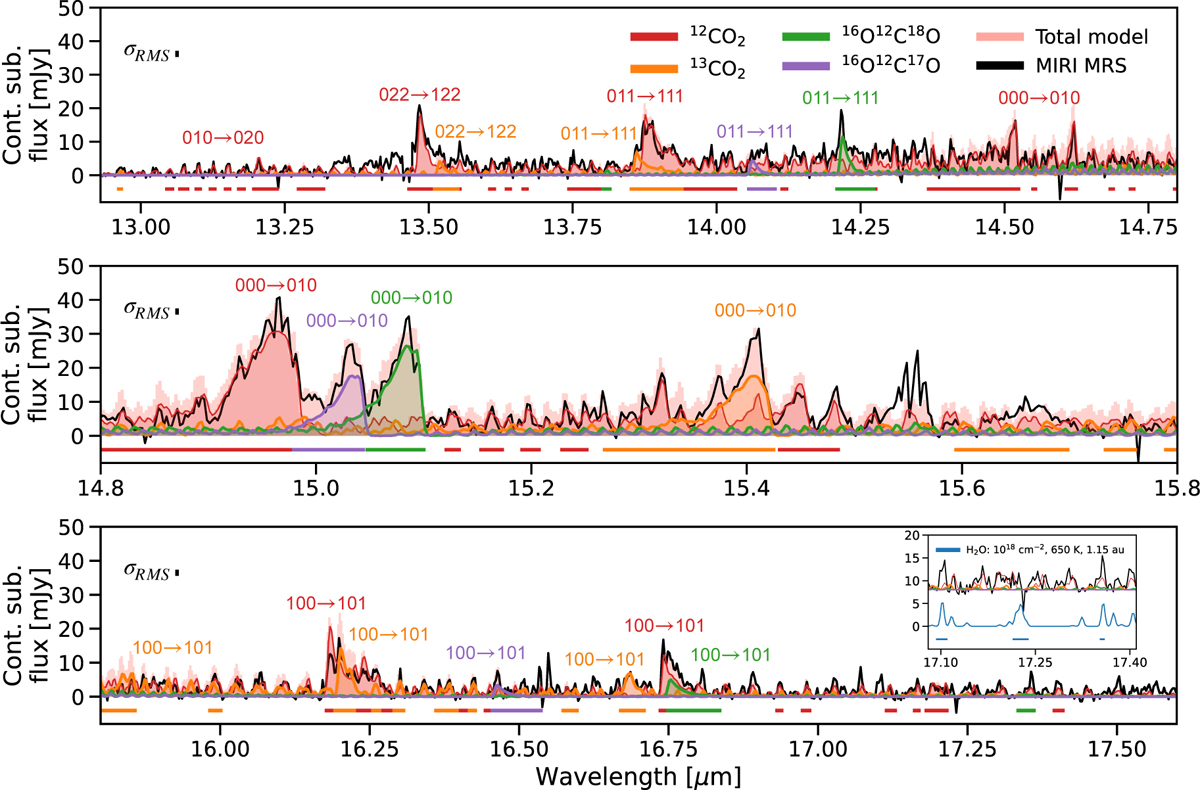
Continuum-subtracted MIRI spectrum of XUE 10 (black) with overlaid best-fit slab models of the identified carbon dioxide isotopologues, 12CO2 (red), 13CO2 (orange), 16O12C18O (green), and 16O12C17O (purple) between 12.93 and 17.6 μm (from top to bottom). The vibrational quantum numbers (v1v2v3) corresponding to the fundamental v2 Q-branch, and its associated hot bands are labeled for each species. The inset in the bottom panel shows the fiducial LTE slab model of H2O that matches the observed line luminosity between 17.08 and 17.4 μm. The colored horizontal bars indicate the fit wavelength ranges for CO2 listed in Table D.1. The spectral uncertainty is indicated in each panel.
Current usage metrics show cumulative count of Article Views (full-text article views including HTML views, PDF and ePub downloads, according to the available data) and Abstracts Views on Vision4Press platform.
Data correspond to usage on the plateform after 2015. The current usage metrics is available 48-96 hours after online publication and is updated daily on week days.
Initial download of the metrics may take a while.