Fig. 4
Download original image
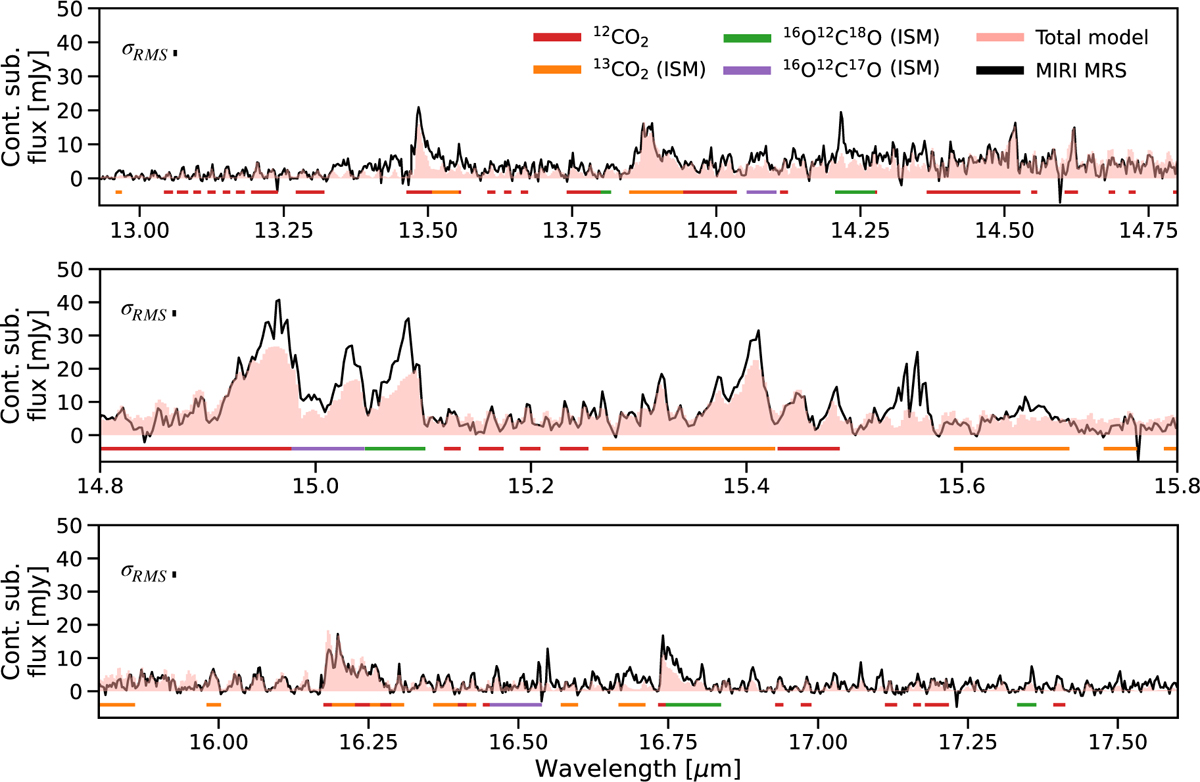
Continuum-subtracted MIRI spectrum of XUE 10 (black) overlaid with the total slab model of 12CO2, 13CO2, 16O12C18O, and 16O12C17O between 12.93 and 17.6 μm (from top to bottom panel) assuming ISM isotopic ratios in the column density. The colored horizontal bars indicate the fit wavelength ranges per species listed in Table D.1. The spectral uncertainty is indicated in each panel.
Current usage metrics show cumulative count of Article Views (full-text article views including HTML views, PDF and ePub downloads, according to the available data) and Abstracts Views on Vision4Press platform.
Data correspond to usage on the plateform after 2015. The current usage metrics is available 48-96 hours after online publication and is updated daily on week days.
Initial download of the metrics may take a while.