Open Access
Fig. 5
Download original image
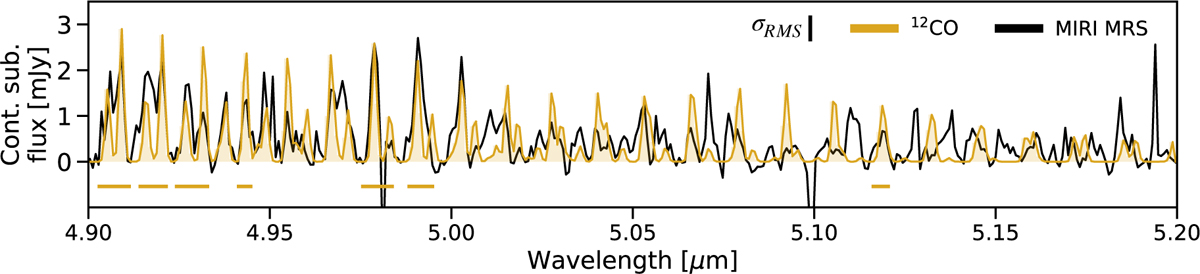
Continuum-subtracted MIRI spectrum of XUE 10 (black) overlaid with the best-fit slab models of carbon monoxide (12CO; gold). The colored horizontal bars indicate the fit wavelength ranges listed in Table D.1. The spectral uncertainty is labeled in figure.
Current usage metrics show cumulative count of Article Views (full-text article views including HTML views, PDF and ePub downloads, according to the available data) and Abstracts Views on Vision4Press platform.
Data correspond to usage on the plateform after 2015. The current usage metrics is available 48-96 hours after online publication and is updated daily on week days.
Initial download of the metrics may take a while.