Fig. 6
Download original image
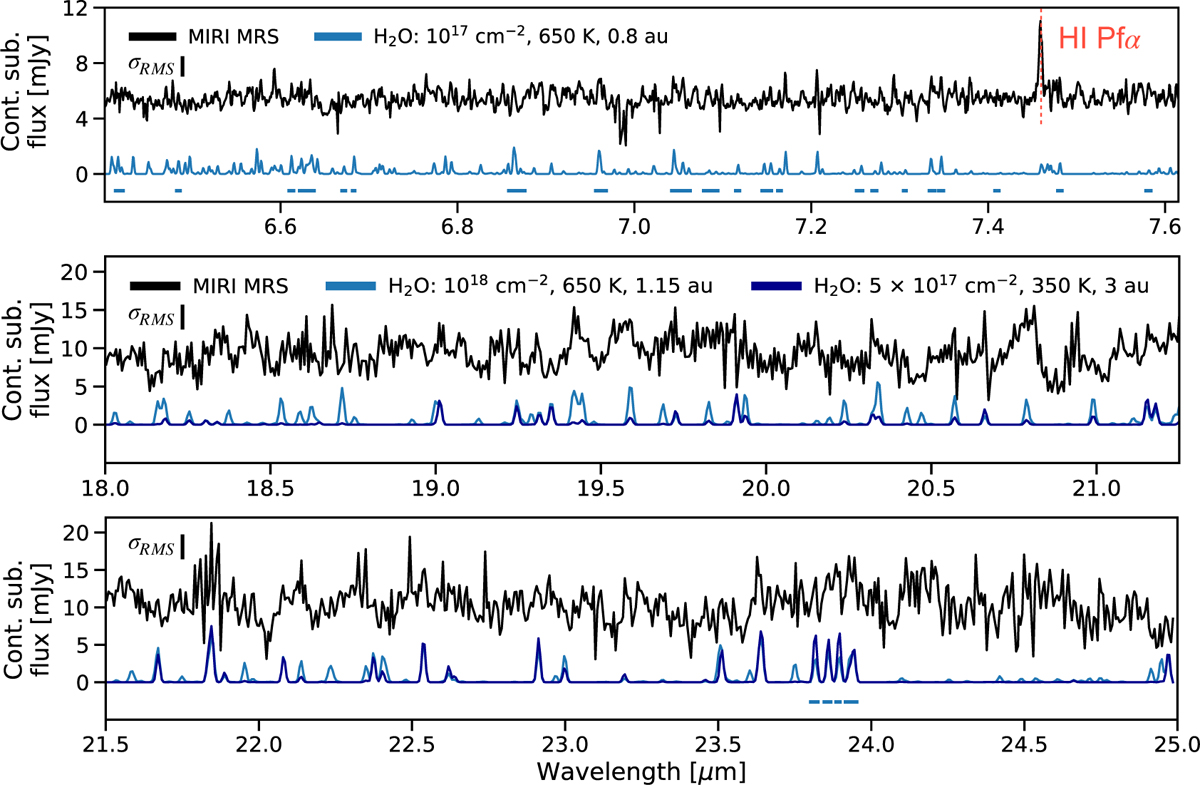
Continuum-subtracted MIRI spectrum of XUE 10 (black) and fiducial LTE slab models of H2O between 6.4 and 7.6 μm (top panel) and between 18 and 25 μm (middle and bottom panels). The observed spectrum is vertically offset for visual clarity. The vertical dotted line marks the detected Hα line of the Pfund series. The colored horizontal bars indicate where H2O lines are tentatively identified. The spectral uncertainty is indicated in each panel.
Current usage metrics show cumulative count of Article Views (full-text article views including HTML views, PDF and ePub downloads, according to the available data) and Abstracts Views on Vision4Press platform.
Data correspond to usage on the plateform after 2015. The current usage metrics is available 48-96 hours after online publication and is updated daily on week days.
Initial download of the metrics may take a while.