Fig. 8
Download original image
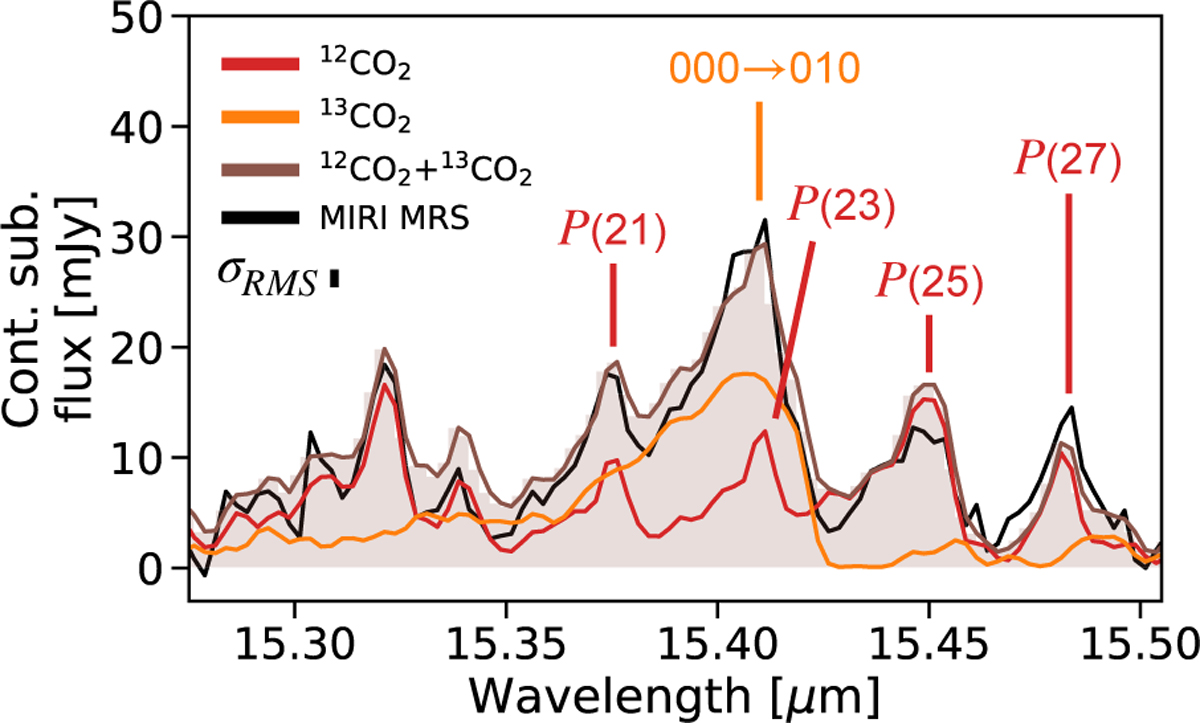
Comparison of the 13CO2 fundamental v2 Q-branch (orange) with 12CO2 P-branch lines (red) in the continuum-subtracted spectrum of XUE 10 (black). The orange and red curves refer respectively to the 13CO2 and 12CO2 best-fit slab models. In brown with shaded filling, we indicate the sum of the two models. The spectral uncertainty is labeled in the figure.
Current usage metrics show cumulative count of Article Views (full-text article views including HTML views, PDF and ePub downloads, according to the available data) and Abstracts Views on Vision4Press platform.
Data correspond to usage on the plateform after 2015. The current usage metrics is available 48-96 hours after online publication and is updated daily on week days.
Initial download of the metrics may take a while.