Fig. 9
Download original image
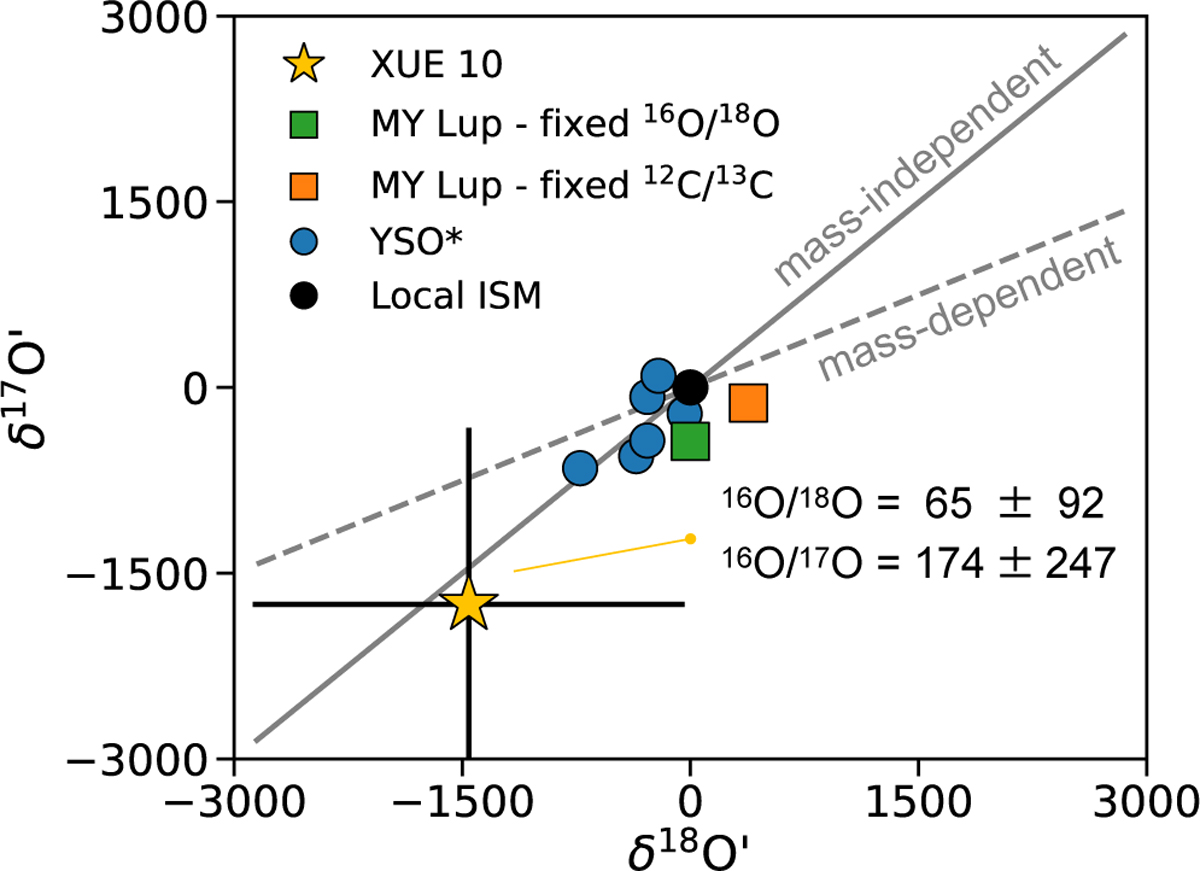
Oxygen isotope fractionation of protostellar systems relative to the ISM (black circle). Solid and dashed lines have a slope of 0.5 and 1, as expected respectively for mass-independent and mass-dependent isotopic fractionation. XUE 10 is shown with a star marker and error bars, and the derived ratios are also labeled with uncertainties. The green and orange square markers refer to the values derived from CO2 emission toward MY Lup with different assumptions (Salyk et al. 2025). The blue circles indicate the isotopic ratios derived from CO emission toward the sample of nearby young solar analogs (YSOs) from Smith et al. (2015).
Current usage metrics show cumulative count of Article Views (full-text article views including HTML views, PDF and ePub downloads, according to the available data) and Abstracts Views on Vision4Press platform.
Data correspond to usage on the plateform after 2015. The current usage metrics is available 48-96 hours after online publication and is updated daily on week days.
Initial download of the metrics may take a while.