Fig. 1
Download original image
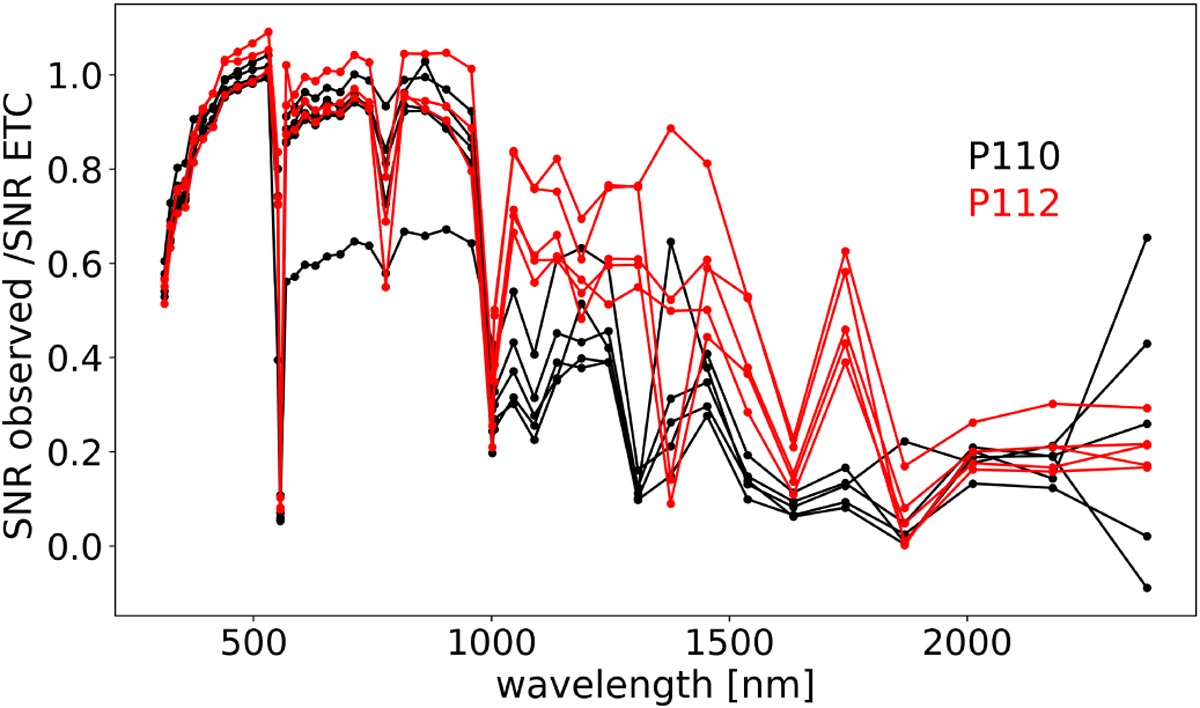
Ratio of the S/N derived from the observed data by the X-shooter pipeline and the S/N predicted by the ETC for the actual observing conditions, at both blaze wavelengths of each order. The black lines show the results for the NIR data from P110 (slit width 5′′), while the red lines show the results for P112 (slit width 1.2′′). The blaze wavelengths 1376 nm and 1867 nm are strongly affected by telluric absorption, and the region around 1634 nm has strong sky emission lines.
Current usage metrics show cumulative count of Article Views (full-text article views including HTML views, PDF and ePub downloads, according to the available data) and Abstracts Views on Vision4Press platform.
Data correspond to usage on the plateform after 2015. The current usage metrics is available 48-96 hours after online publication and is updated daily on week days.
Initial download of the metrics may take a while.