Fig. 2
Download original image
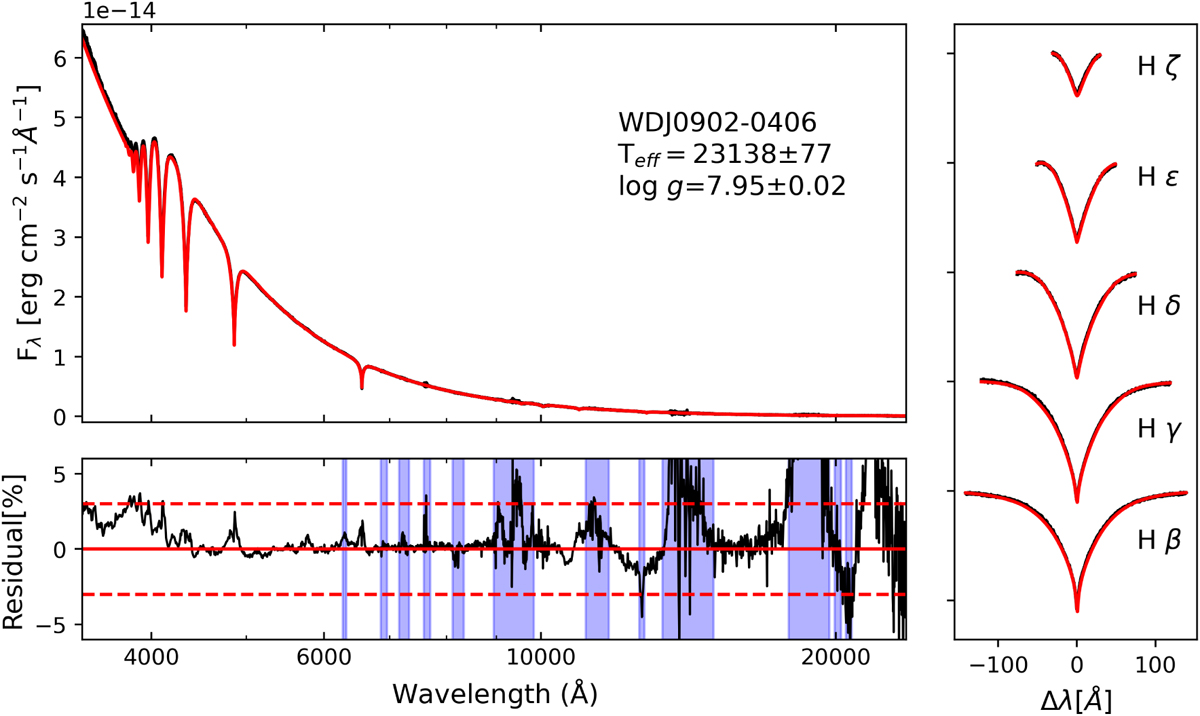
Spectrophotometric fits of the X-shooter data for our sample white dwarf WDJ0902–0406. Top-left panel: SED fit between the observed spectrophotometry (black) and best-fitting model (red). The adopted atmospheric parameters are indicated. Bottom-left panel: flux residuals from the corresponding SED fit. The black line is the calculated residual, and red horizontal lines show residuals of 0 and ± 3% as a guide. The vertical blue bands indicate wavelength ranges contaminated by telluric lines. Right panel: Balmer line fits for Hβ to Hζ between the observed spectrophotometry (black) and best-fitting model (red). The line profiles are vertically offset for clarity. Analogous plots for the remaining 13 flux standard white dwarfs are shown in Appendix A.
Current usage metrics show cumulative count of Article Views (full-text article views including HTML views, PDF and ePub downloads, according to the available data) and Abstracts Views on Vision4Press platform.
Data correspond to usage on the plateform after 2015. The current usage metrics is available 48-96 hours after online publication and is updated daily on week days.
Initial download of the metrics may take a while.