Open Access
Fig. 6
Download original image
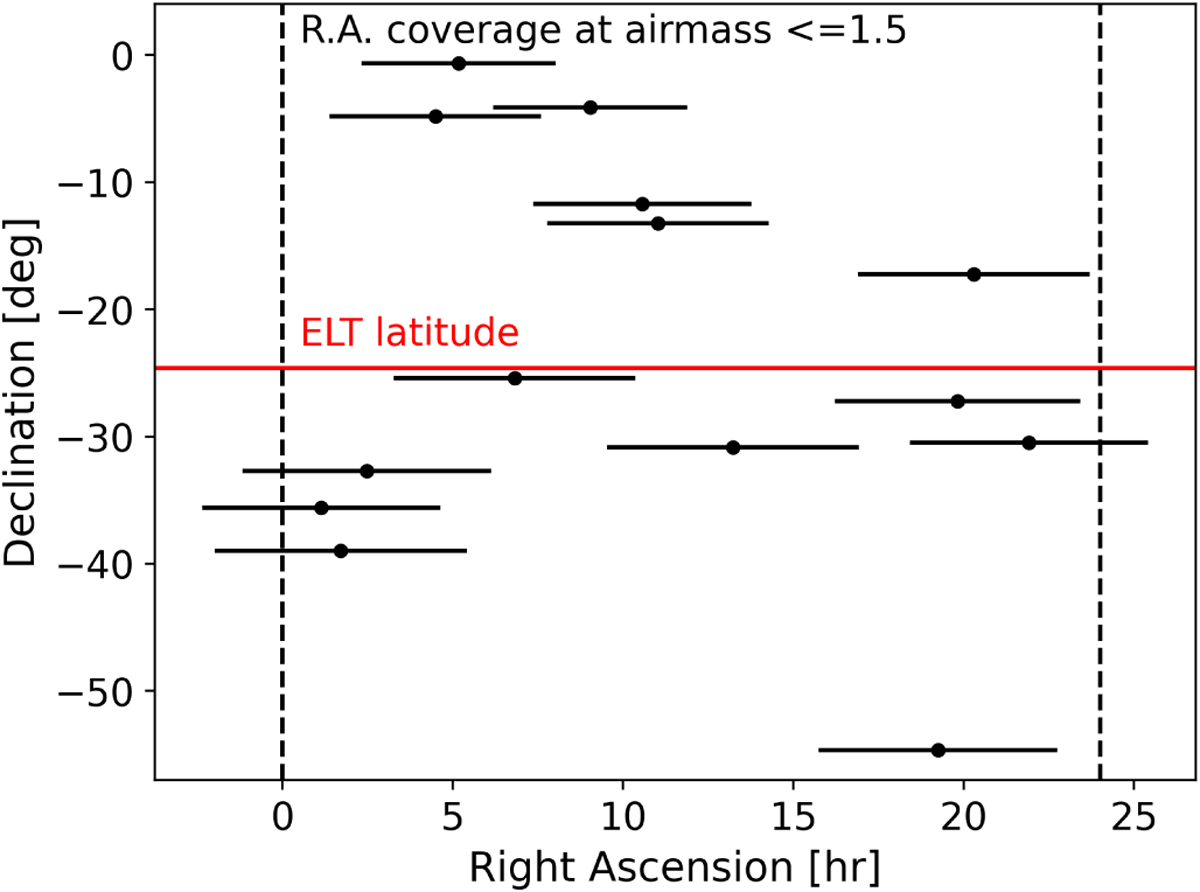
RA and Dec distribution of the 14 standard stars from Table 2 and their RA coverage at an airmass of up to 1.5. The red line marks the latitude of the ELT, illustrating that the range in RA is fully covered by stars south of the ELT.
Current usage metrics show cumulative count of Article Views (full-text article views including HTML views, PDF and ePub downloads, according to the available data) and Abstracts Views on Vision4Press platform.
Data correspond to usage on the plateform after 2015. The current usage metrics is available 48-96 hours after online publication and is updated daily on week days.
Initial download of the metrics may take a while.