Open Access
Fig. 4
Download original image
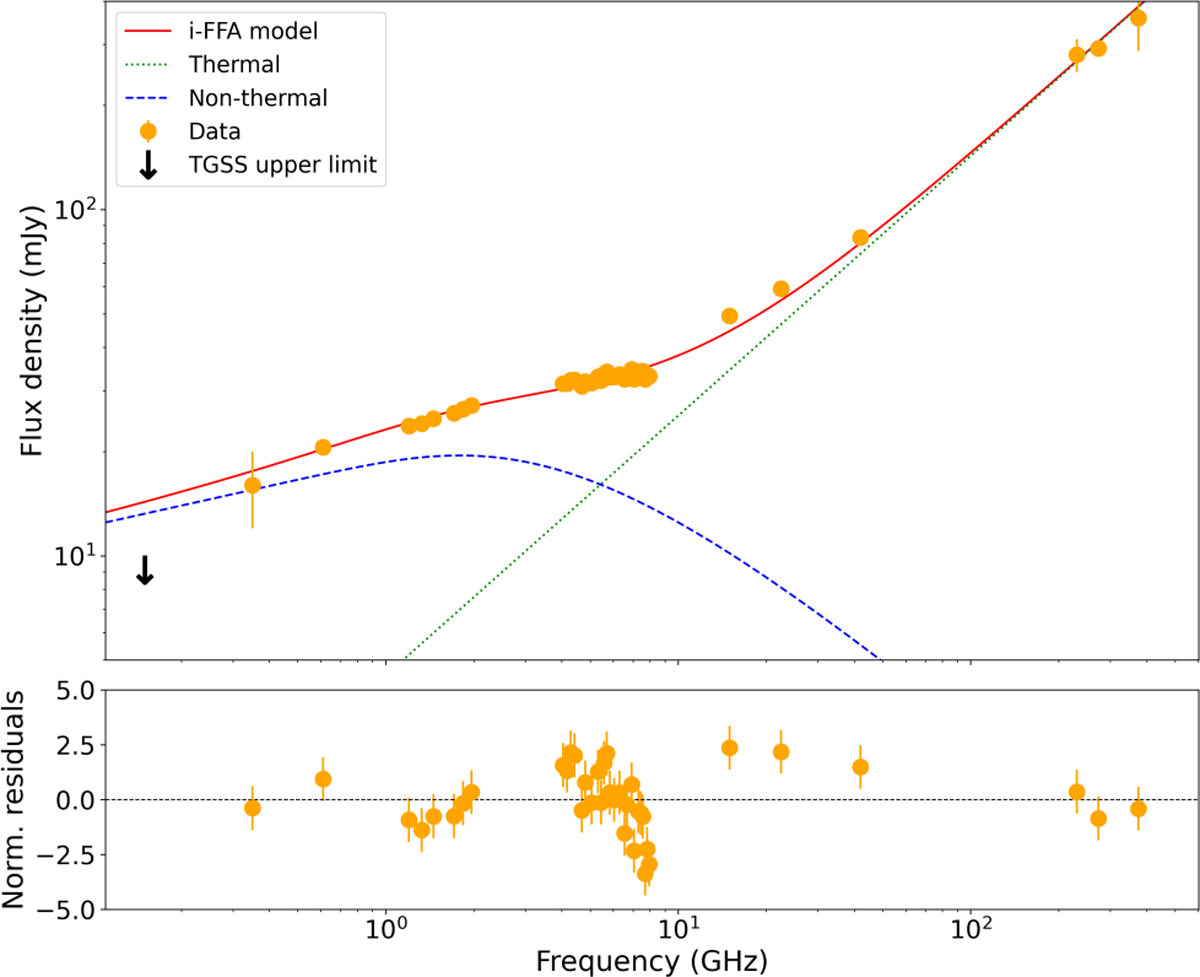
Upper panel: best-fit i-FFA model and data, with αT and αNT fixed to 0.75 and 0.7, respectively. The TGSS upper limit is shown with a black arrow. Lower panel: normalised residuals in the sense data minus model.
Current usage metrics show cumulative count of Article Views (full-text article views including HTML views, PDF and ePub downloads, according to the available data) and Abstracts Views on Vision4Press platform.
Data correspond to usage on the plateform after 2015. The current usage metrics is available 48-96 hours after online publication and is updated daily on week days.
Initial download of the metrics may take a while.