Fig. 4
Download original image
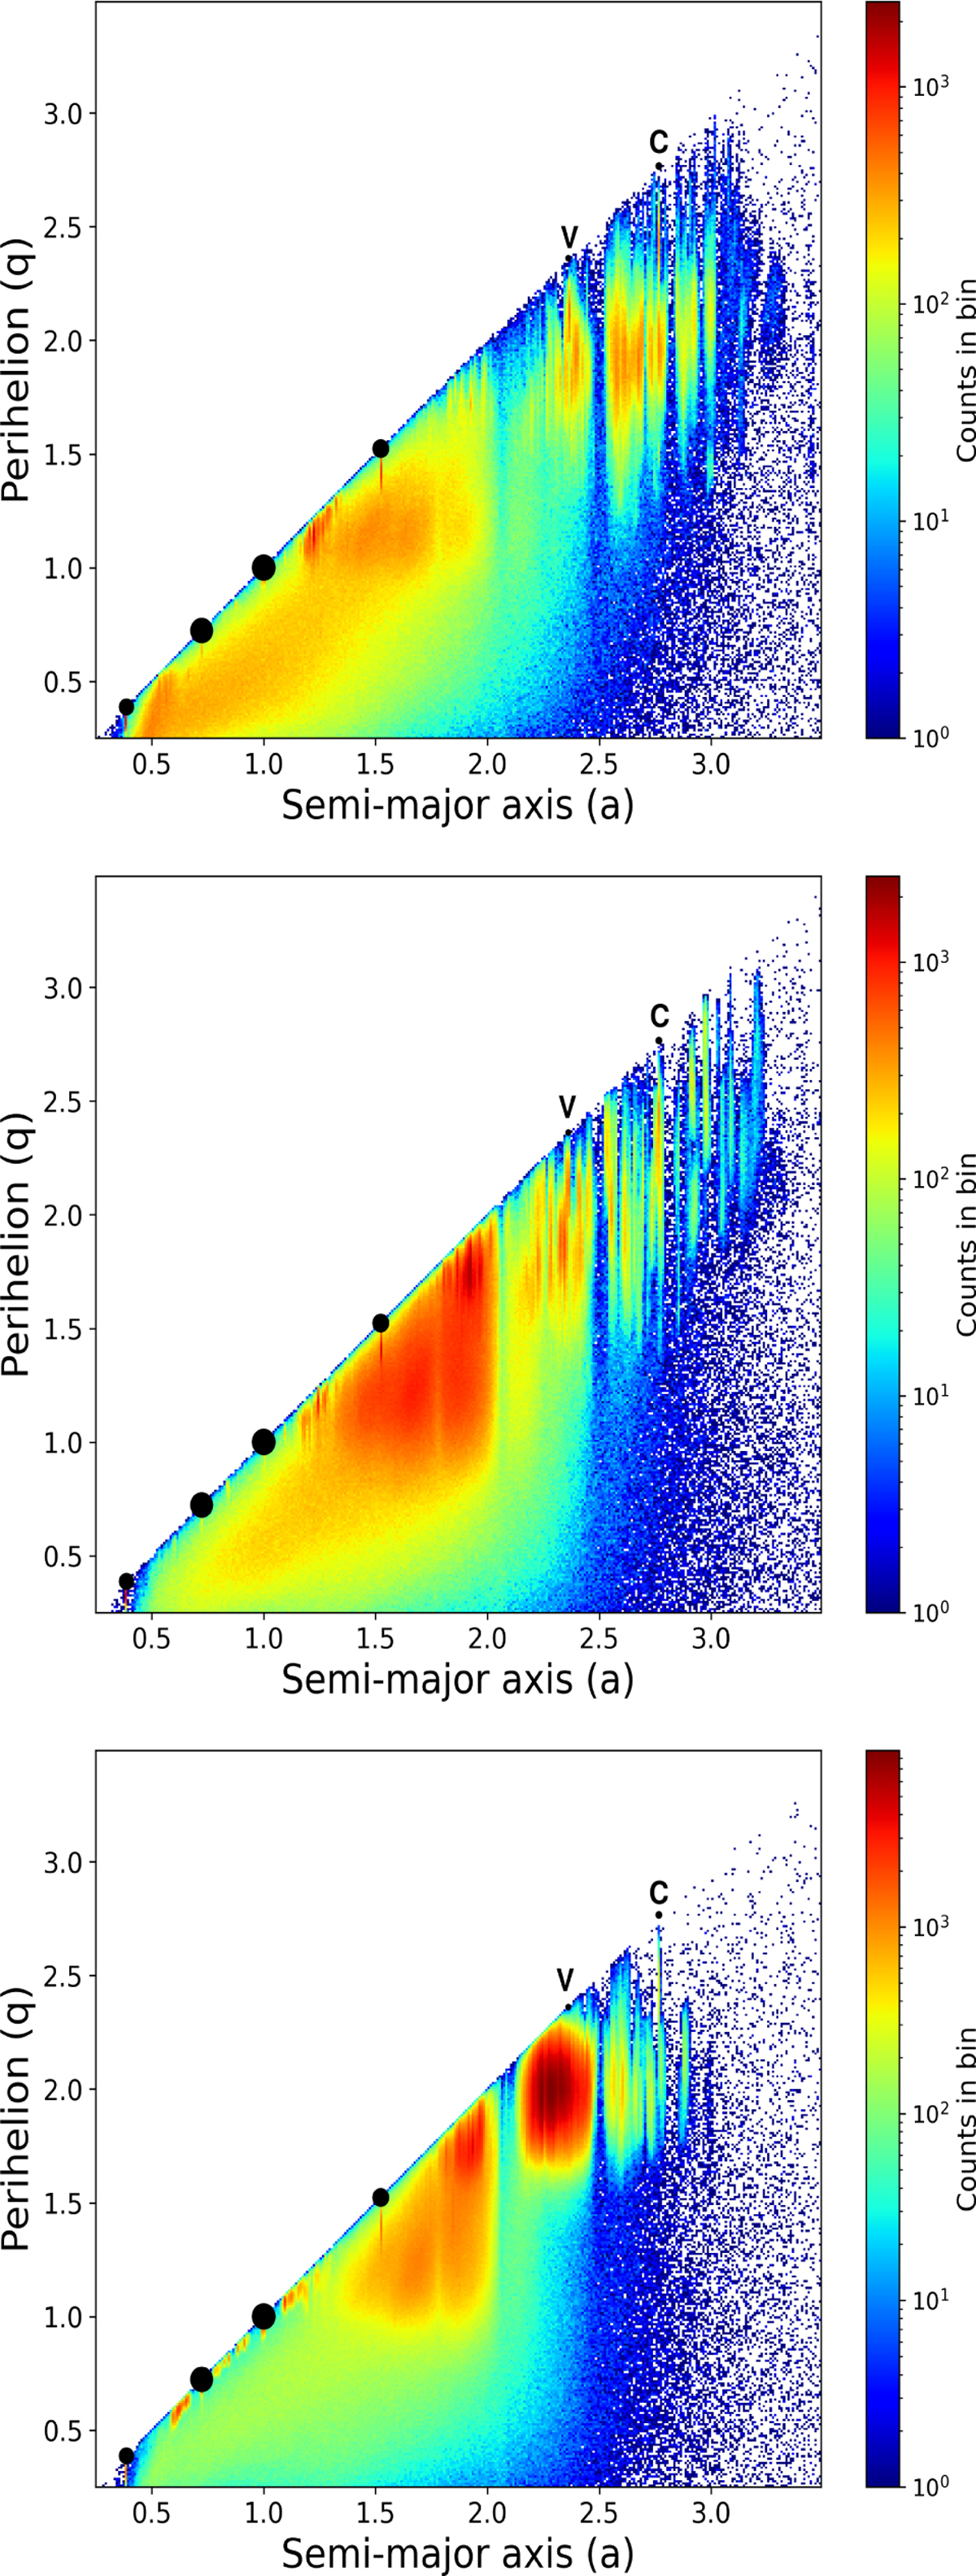
Heat maps of the dynamical evolution of planetesimals showing the semi-major axis versus perihelion for all three models: GT (top), ABI (middle), and DD (bottom). The density increases from blue to red, with blue dots indicating few planetesimals ventured in a specific region of phase space, and red indicating that many remained in said region. The planets are indicated by large black bullets. The letters V and C stand for Vesta and Ceres.
Current usage metrics show cumulative count of Article Views (full-text article views including HTML views, PDF and ePub downloads, according to the available data) and Abstracts Views on Vision4Press platform.
Data correspond to usage on the plateform after 2015. The current usage metrics is available 48-96 hours after online publication and is updated daily on week days.
Initial download of the metrics may take a while.