Open Access
Fig. 6
Download original image
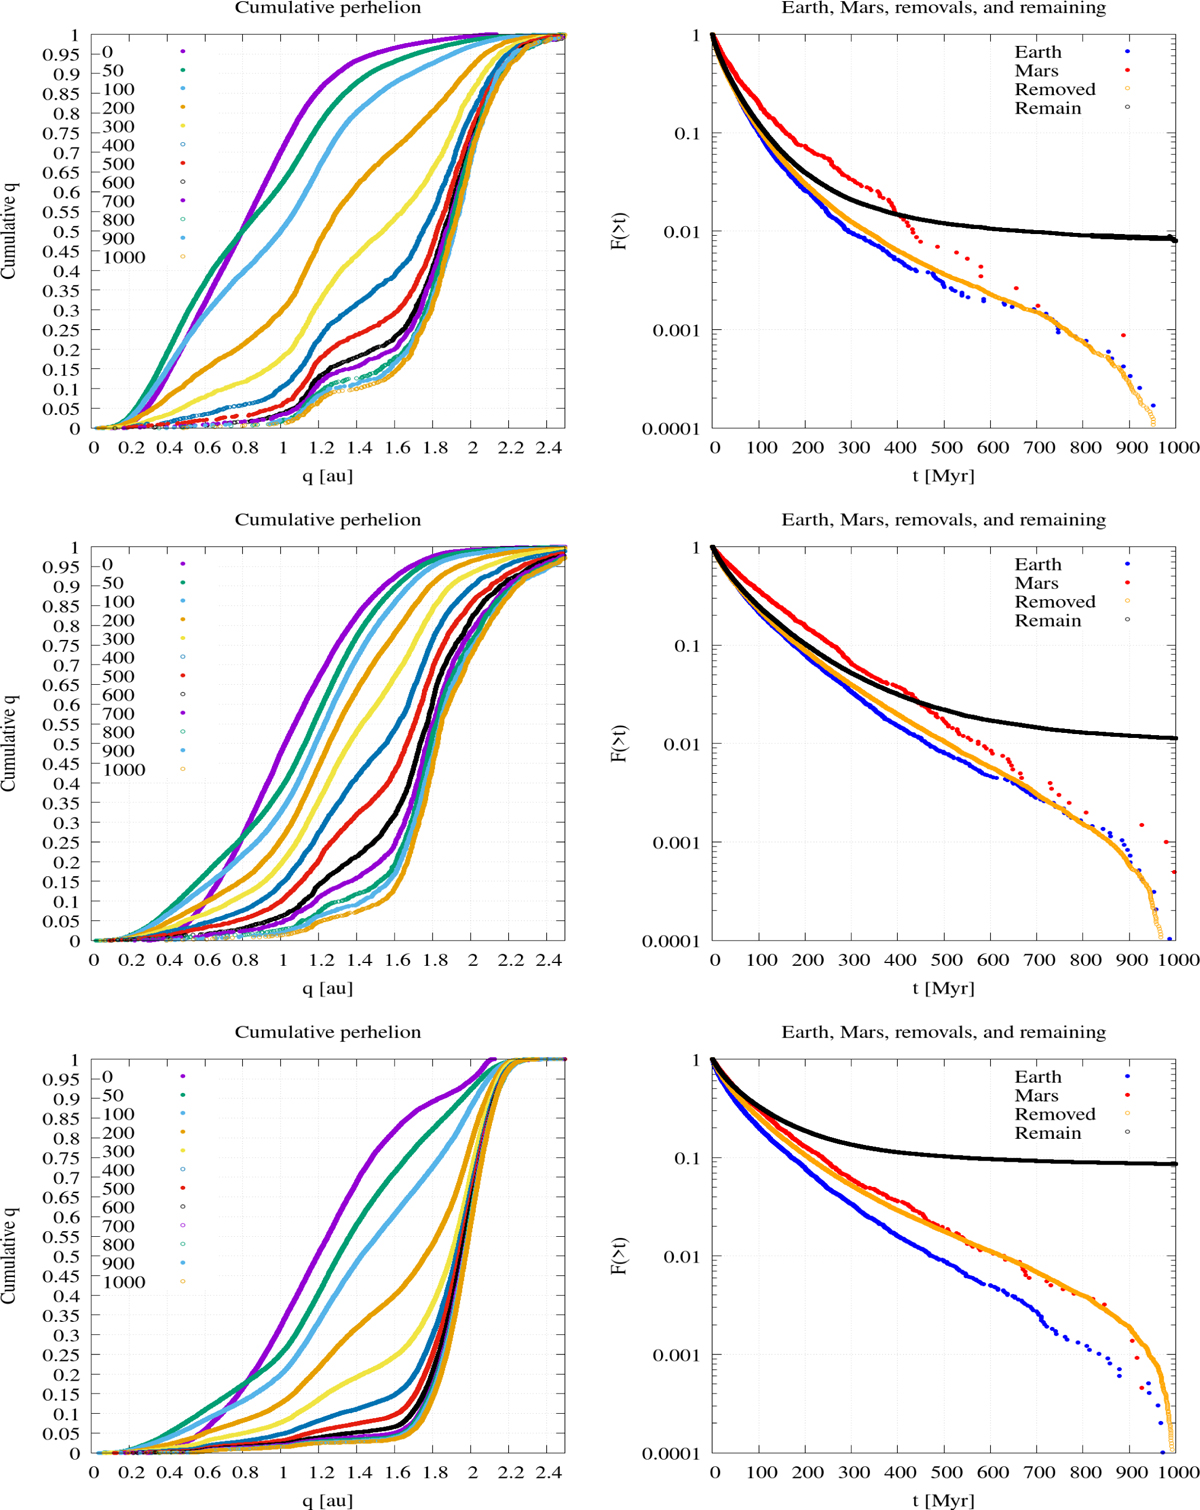
Left column: evolution of the cumulative perihelion distribution. Right column: impacts on Earth (blue) and Mars (red), the fraction of planetesimals remaining (black), and the total planetesimals that are removed (orange) for GT (top), ABI (middle), and DD (bottom).
Current usage metrics show cumulative count of Article Views (full-text article views including HTML views, PDF and ePub downloads, according to the available data) and Abstracts Views on Vision4Press platform.
Data correspond to usage on the plateform after 2015. The current usage metrics is available 48-96 hours after online publication and is updated daily on week days.
Initial download of the metrics may take a while.