Fig. 7
Download original image
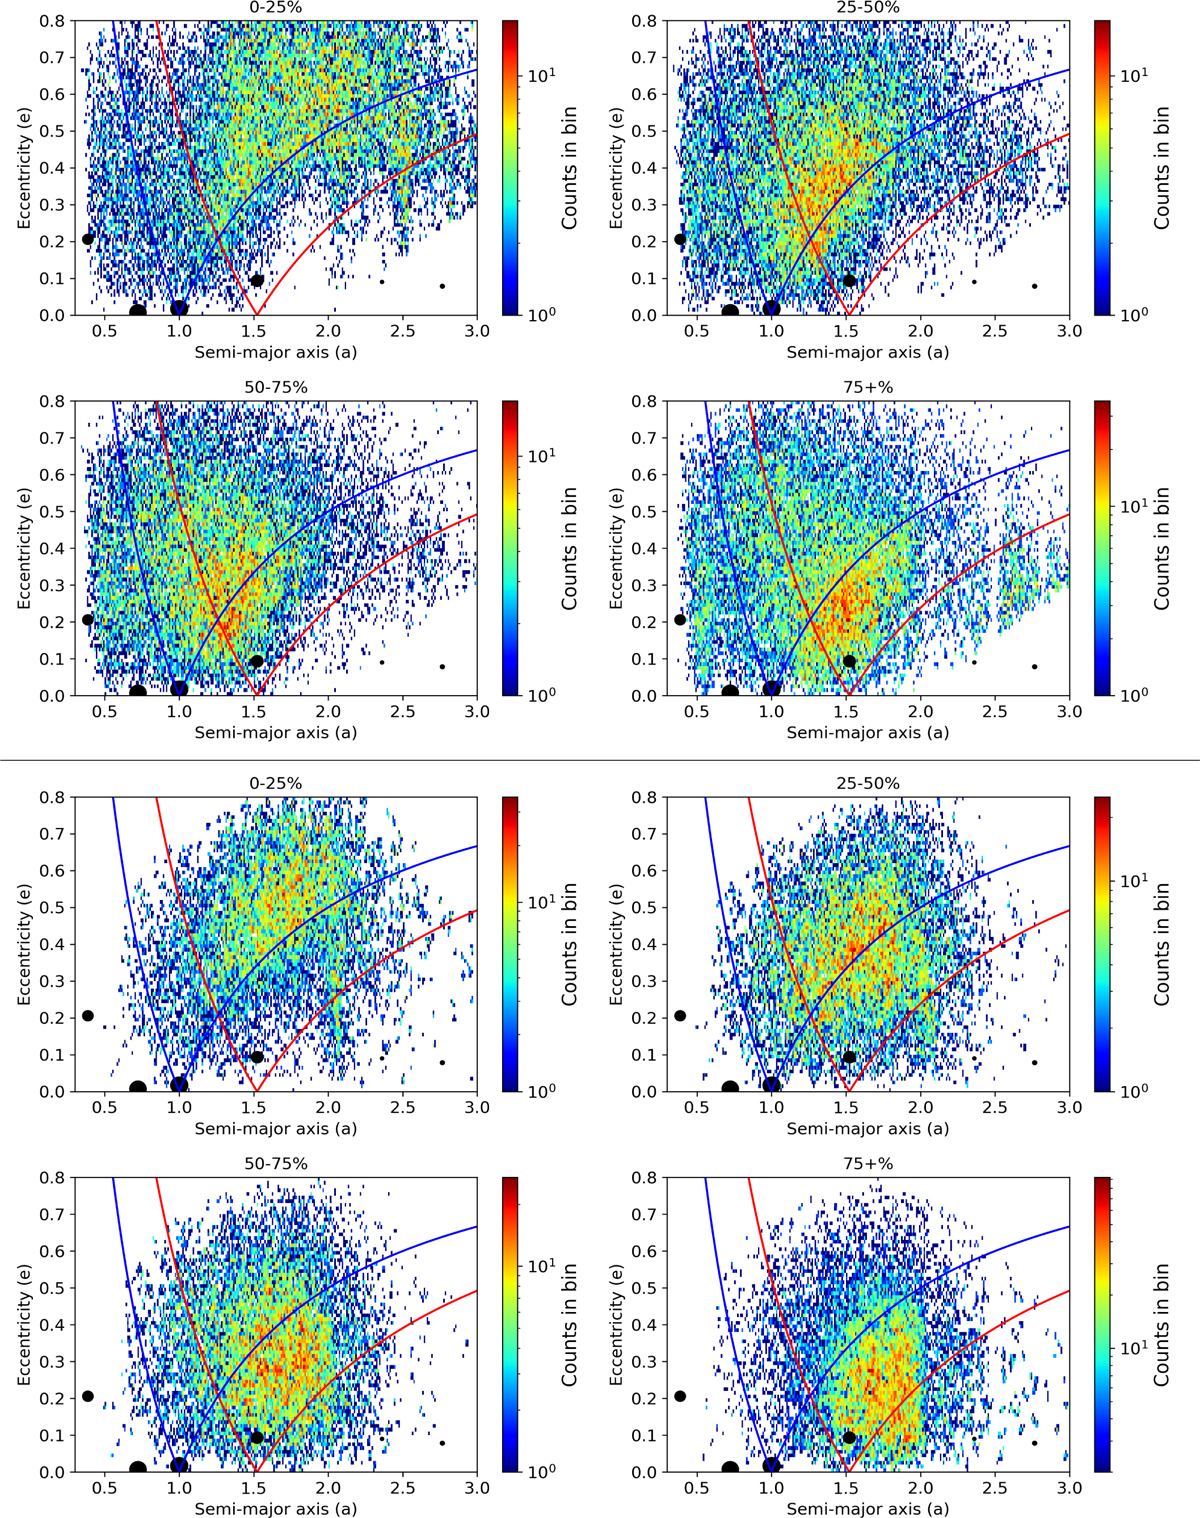
Heat maps of the initial semi-major axis versus eccentricity of planetesimals that are removed at different quartiles during the simulation. Red and blue lines indicate Mars- and Earth-crossing orbits. The top four panels are for the GT model and the bottom four panels are for the ABI model. Panel titles indicate the quartile.
Current usage metrics show cumulative count of Article Views (full-text article views including HTML views, PDF and ePub downloads, according to the available data) and Abstracts Views on Vision4Press platform.
Data correspond to usage on the plateform after 2015. The current usage metrics is available 48-96 hours after online publication and is updated daily on week days.
Initial download of the metrics may take a while.