Fig. 1.
Download original image
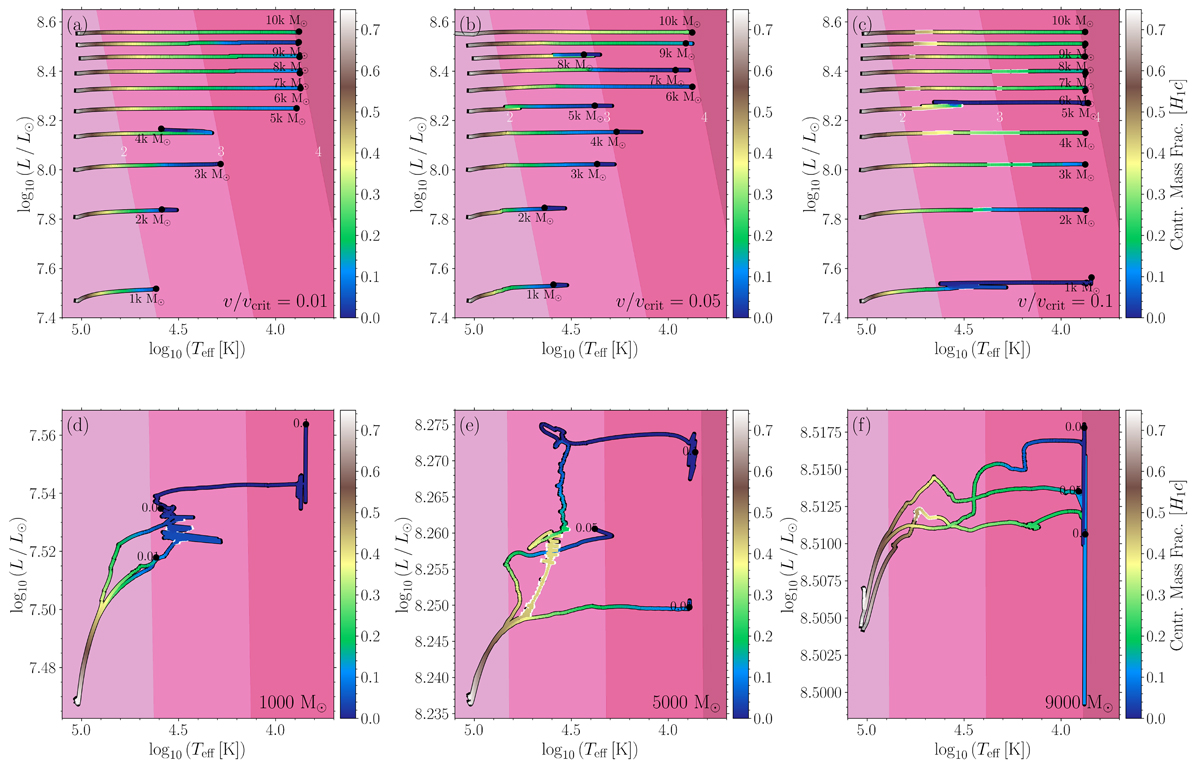
SMS evolution on the HR diagram. The colourbar indicates central H mass fractions, Xc, and the shaded red regions show the isoradii lines: the lightest shade corresponds to log (R/R⊙) = 1 and the darkest shade to log (R/R⊙) = 4. The white outline around the stellar tracks correspond to the evolutionary stage where the ΩΓ-limit is encountered. Top row: 1000–10 000 M⊙ stars at initial rotation rates v/vcrit = 0.01 (a), 0.05 (b), and 0.10 (c). Bottom row: comparison of rotation rates at a given mass, 1000 M⊙ (d), 5000 M⊙ (e), and 9000 M⊙ (f).
Current usage metrics show cumulative count of Article Views (full-text article views including HTML views, PDF and ePub downloads, according to the available data) and Abstracts Views on Vision4Press platform.
Data correspond to usage on the plateform after 2015. The current usage metrics is available 48-96 hours after online publication and is updated daily on week days.
Initial download of the metrics may take a while.