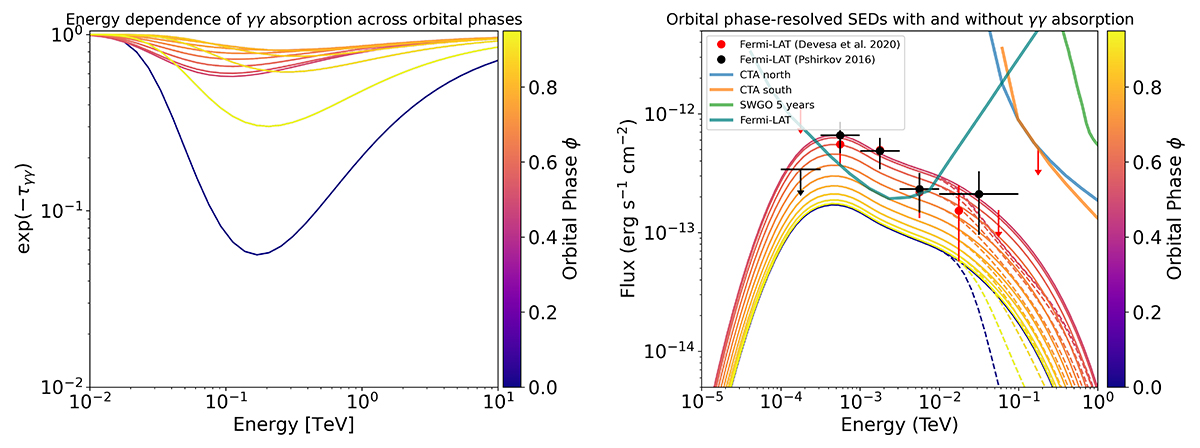
Fig. 2.
Download original image
The left panel shows the attenuation factor exp(−τγγ) as a function of energy and orbital phase used in this model. The right panel shows the phase-dependent model SEDs varying across the orbital phases, along with the Fermi-LAT data points (Pshirkov 2016; Martí-Devesa et al. 2020). The CTA, SWGO, and Fermi-LAT sensitivities are also shown in the figure for comparison purposes. The Fermi-LAT sensitivity corresponds to the 10-year benchmark (P8R3_SOURCE_V3), assuming a point source with a power-law spectrum in a uniform diffuse background. It serves as a reference only and does not represent a strict detection threshold. Variations in background intensity and exposure at the location of γ2 Velorum, along with low test statistics (TS) or large uncertainties, can cause some data points to appear below this curve. The solid lines represent the unabsorbed SEDs, whereas the dashed lines signify the SEDs affected by γ − γ absorption.
Current usage metrics show cumulative count of Article Views (full-text article views including HTML views, PDF and ePub downloads, according to the available data) and Abstracts Views on Vision4Press platform.
Data correspond to usage on the plateform after 2015. The current usage metrics is available 48-96 hours after online publication and is updated daily on week days.
Initial download of the metrics may take a while.