Fig. 1
Download original image
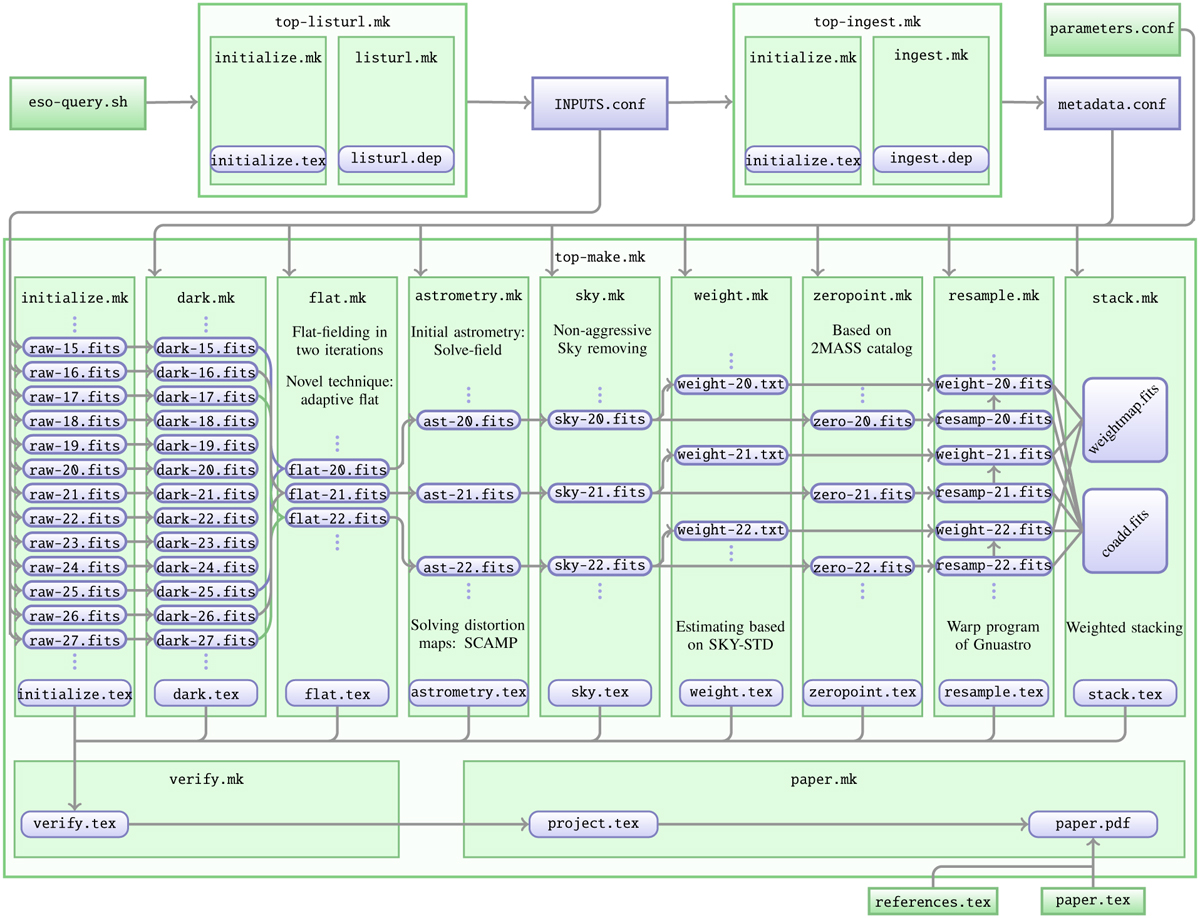
Structural diagram of the NASIM pipeline. Each coloured box represents a file, with arrows indicating the flow of inputs to outputs. Green boxes correspond to plain-text source files that are version-controlled within the project directory, while blue boxes represent output products generated during the build process. The Makefiles (*.mk) define the targets and dependencies that govern the automated execution of each pipeline stage.
Current usage metrics show cumulative count of Article Views (full-text article views including HTML views, PDF and ePub downloads, according to the available data) and Abstracts Views on Vision4Press platform.
Data correspond to usage on the plateform after 2015. The current usage metrics is available 48-96 hours after online publication and is updated daily on week days.
Initial download of the metrics may take a while.