Fig. A.2
Download original image
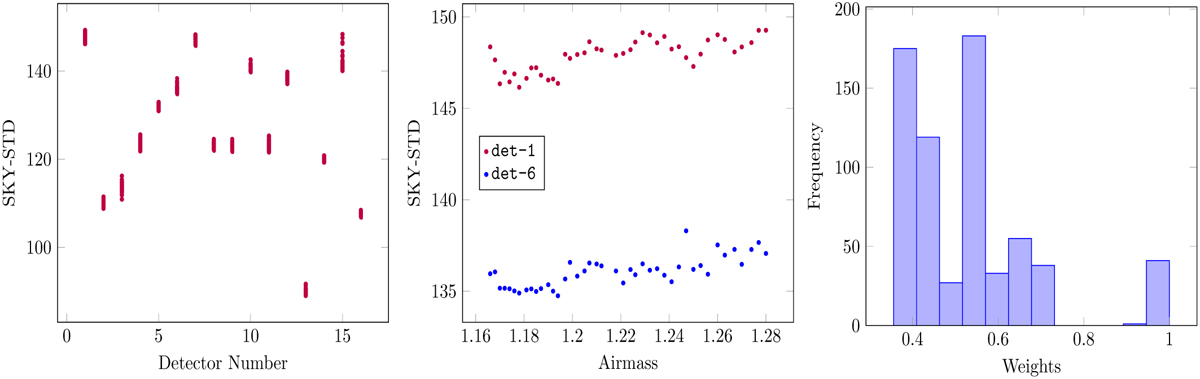
Example of variations in SKY-STD across all images taken during a single night. Left panel: Variations in SKY-STD as a function of detector number, highlighting discernible differences in image quality among detectors. Middle panel: Correlation between SKY-STD and airmass for selected detectors, illustrating the impact of zenith angle on image quality. Right panel: Distribution of computed weights for all images from the night, reflecting the range of observational quality.
Current usage metrics show cumulative count of Article Views (full-text article views including HTML views, PDF and ePub downloads, according to the available data) and Abstracts Views on Vision4Press platform.
Data correspond to usage on the plateform after 2015. The current usage metrics is available 48-96 hours after online publication and is updated daily on week days.
Initial download of the metrics may take a while.