Fig. 4
Download original image
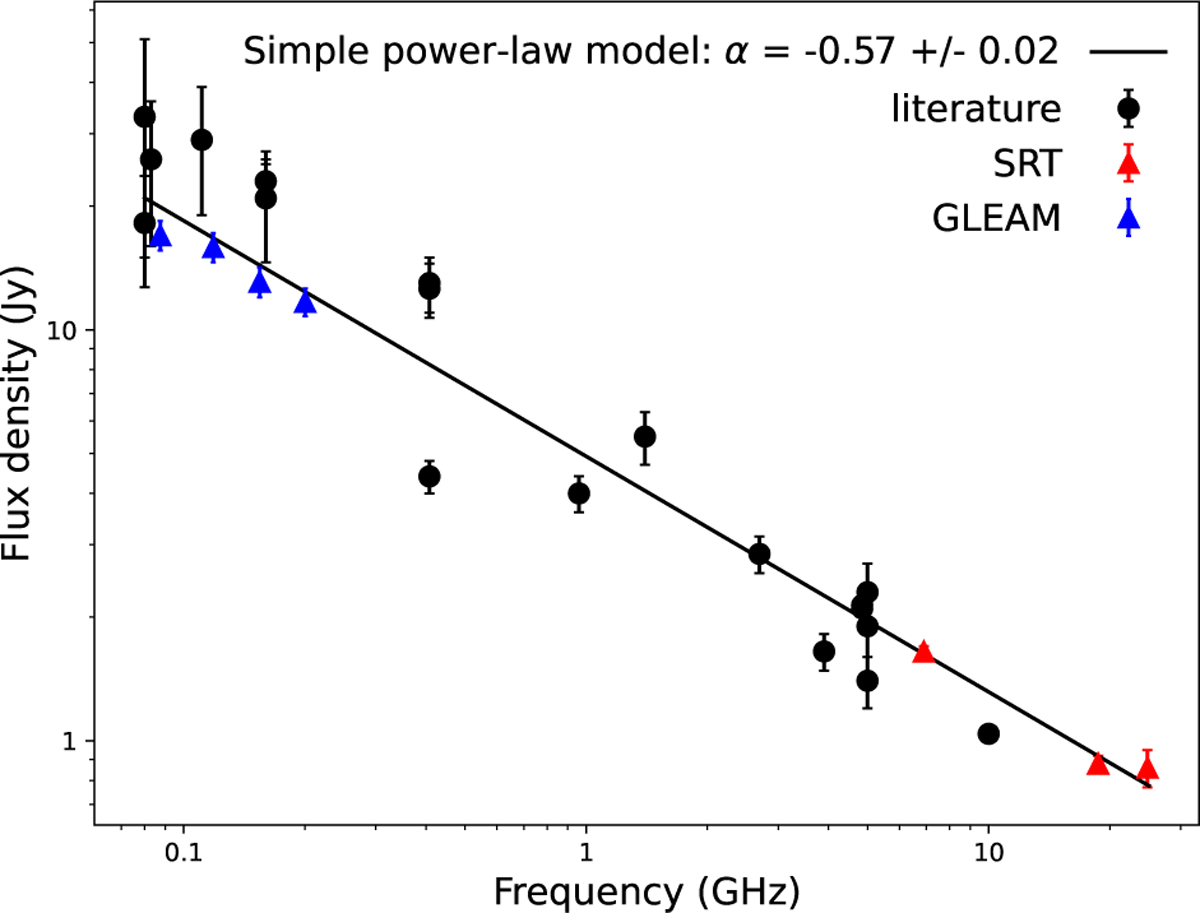
Integrated radio continuum spectrum of Kes 73 including our flux-density measurements from SRT images at 6.9, 18.7, and 24.8 GHz (red triangles) and the public GLEAM images (blue triangles), and flux densities available in the literature (black circles). All values and related references are reported in Table 2. The solid line results from the weighted least-squares fit applied to all data. The point at 10 GHz was not used for the fit.
Current usage metrics show cumulative count of Article Views (full-text article views including HTML views, PDF and ePub downloads, according to the available data) and Abstracts Views on Vision4Press platform.
Data correspond to usage on the plateform after 2015. The current usage metrics is available 48-96 hours after online publication and is updated daily on week days.
Initial download of the metrics may take a while.