Fig. 7
Download original image
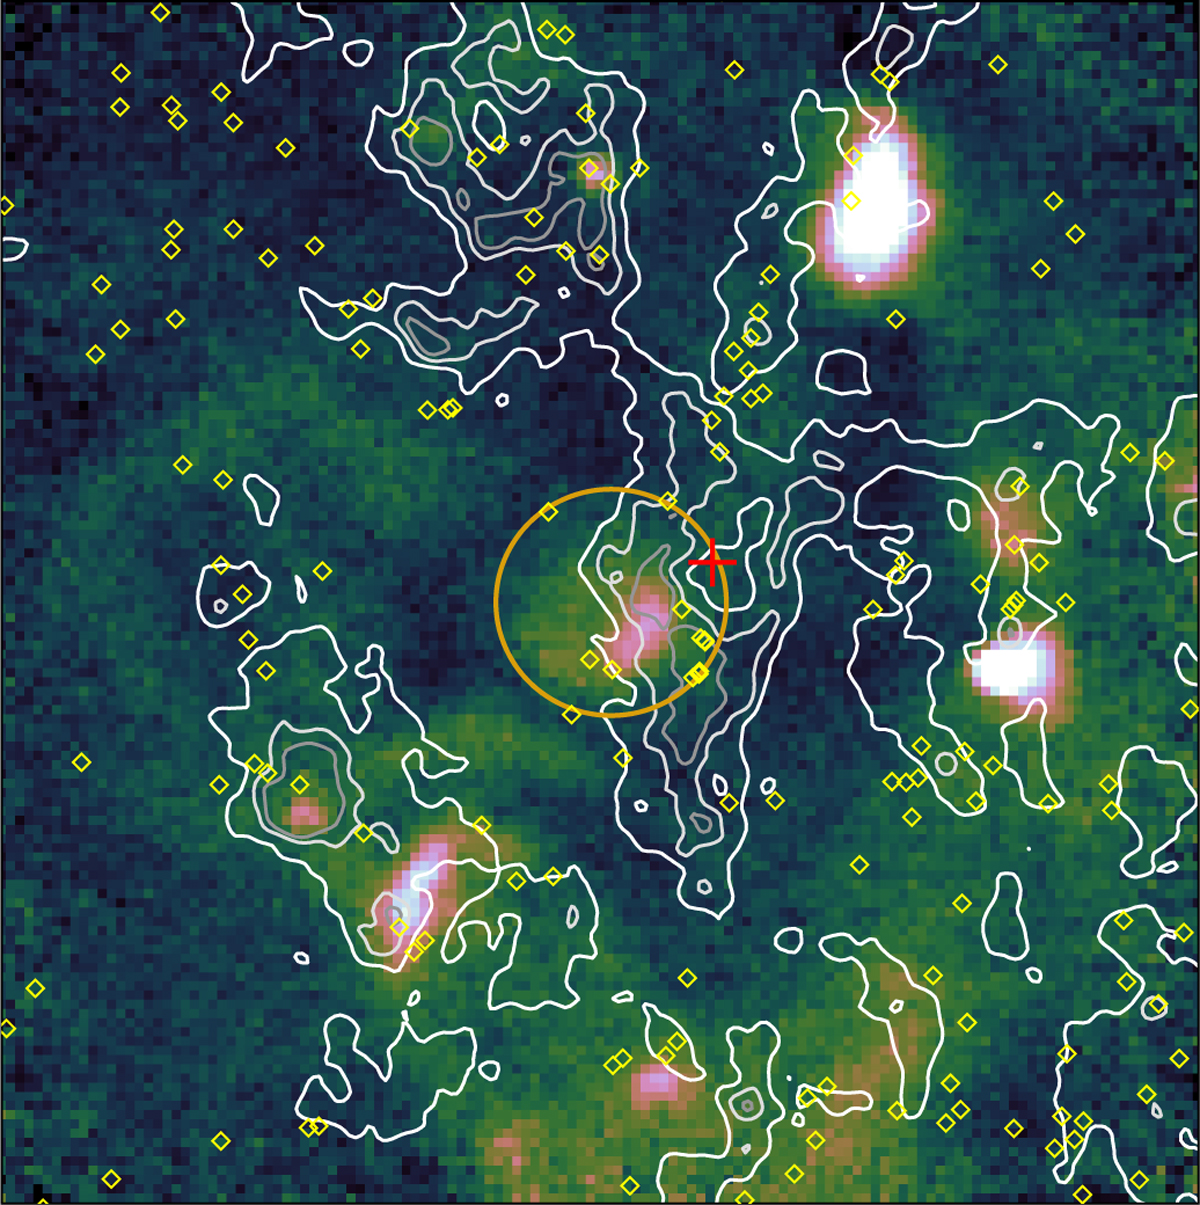
SRT radio image of Kes 73 at 24.8 GHz with contour levels of the 12CO emission superposed. The 12CO emission is integrated on the 85–96 km s–1 velocity interval, and the white, light grey, and grey contours correspond to the temperature levels at 70, 100, and 120 K, respectively. The orange circle marks the extraction region we used to estimate the whole flux density of Kes 73 on our K-band maps, and the red cross the centroid of the Fermi-LAT γ-ray source. The yellow diamonds indicate the YSOs from the SPICY catalogue.
Current usage metrics show cumulative count of Article Views (full-text article views including HTML views, PDF and ePub downloads, according to the available data) and Abstracts Views on Vision4Press platform.
Data correspond to usage on the plateform after 2015. The current usage metrics is available 48-96 hours after online publication and is updated daily on week days.
Initial download of the metrics may take a while.