Fig. 8
Download original image
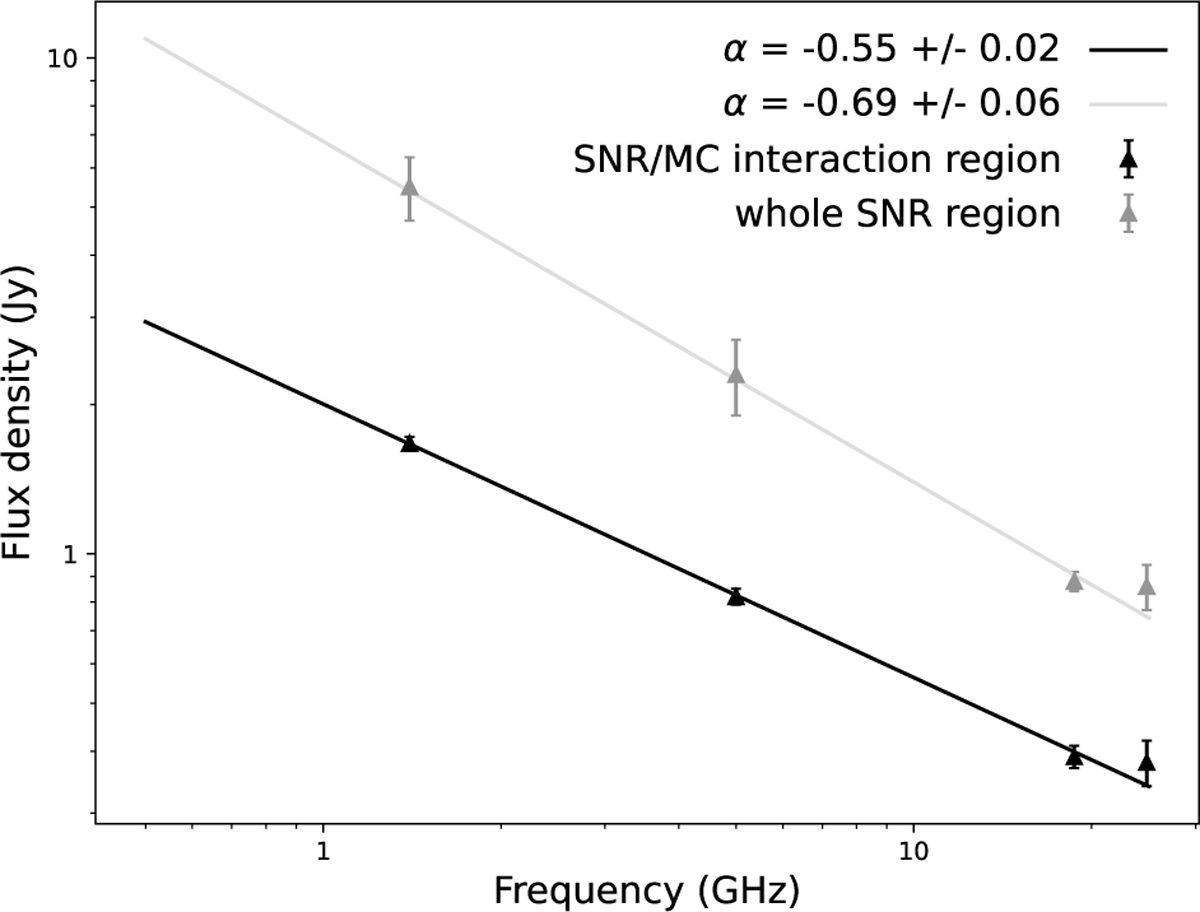
Integrated spectrum of the SNR-MC interaction region (‘bright region’ in Fig. 4) of Kes 73 from 1.4 and 5.0 GHz VLA+GBT and 18.7 and 24.8 GHz SRT images and the related fit from a simple power-law model. For comparison, we also plot the integrated flux densities calculated by considering the whole Kes 73 extension (orange circle in Fig. 4) and related fit.
Current usage metrics show cumulative count of Article Views (full-text article views including HTML views, PDF and ePub downloads, according to the available data) and Abstracts Views on Vision4Press platform.
Data correspond to usage on the plateform after 2015. The current usage metrics is available 48-96 hours after online publication and is updated daily on week days.
Initial download of the metrics may take a while.