Open Access
Fig. 3
Download original image
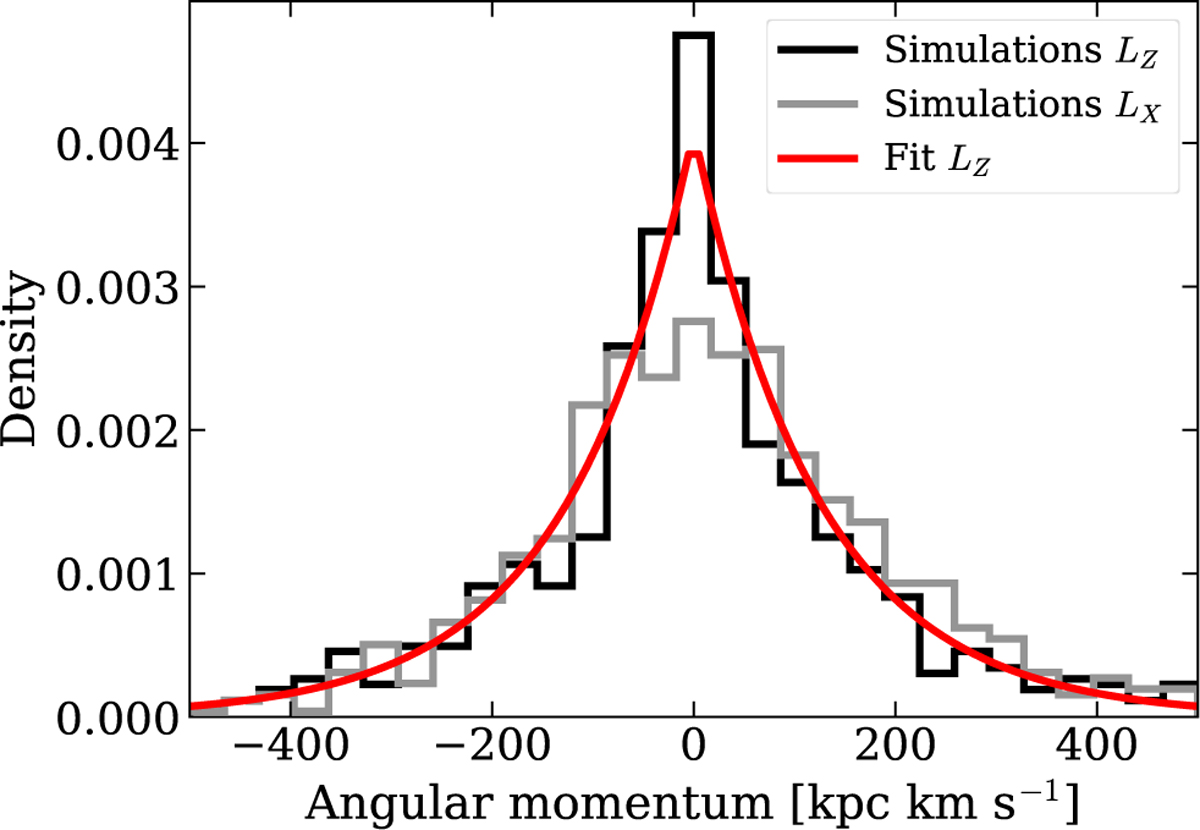
Measured distribution of LZ and LX for GC ejecta in the simulations. Since the true LZ of ejected stars is 0, the observed spread is due to distance uncertainties. We provide a fit to the data in red. In grey we also plot the measured LX distribution.
Current usage metrics show cumulative count of Article Views (full-text article views including HTML views, PDF and ePub downloads, according to the available data) and Abstracts Views on Vision4Press platform.
Data correspond to usage on the plateform after 2015. The current usage metrics is available 48-96 hours after online publication and is updated daily on week days.
Initial download of the metrics may take a while.