Fig. 1
Download original image
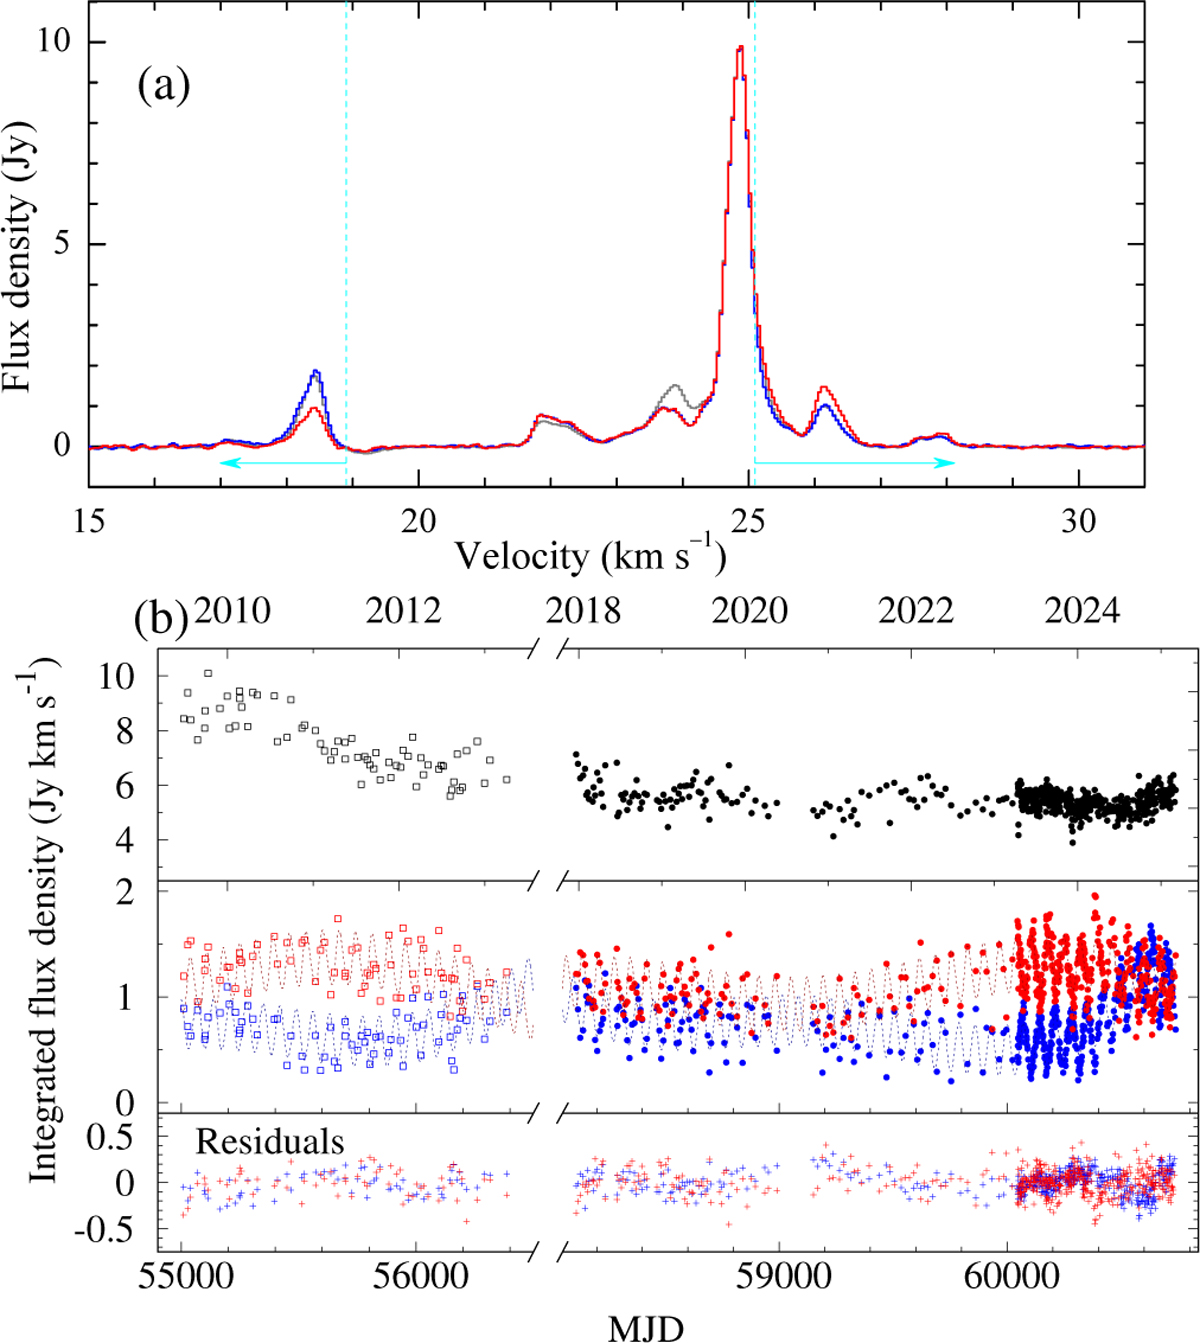
(a) Spectra of G26 averaged over three-week intervals around five consecutive maxima (blue) and minima (red) of the 18.4 km s−1 feature for MJD 60045-60407 observations. The gray line shows the spectrum averaged over 480 observations from MJD 55010 to 60580. The cyan lines and arrows denote the velocity ranges in which the emissions exhibit anticorrelated variability. (b) Time series for velocity-integrated flux density in three velocity ranges: 18.0–18.7 km s−1 (blue), 21.7–25.1 km s−1 (gray), and 25.1–26.6 km s−1 (red). Filled symbols represent the new data, and the data from Szymczak et al. (2018) are open. A sinusoidal function fits the blueshifted and redshifted emission light curves.
Current usage metrics show cumulative count of Article Views (full-text article views including HTML views, PDF and ePub downloads, according to the available data) and Abstracts Views on Vision4Press platform.
Data correspond to usage on the plateform after 2015. The current usage metrics is available 48-96 hours after online publication and is updated daily on week days.
Initial download of the metrics may take a while.