Fig. 2
Download original image
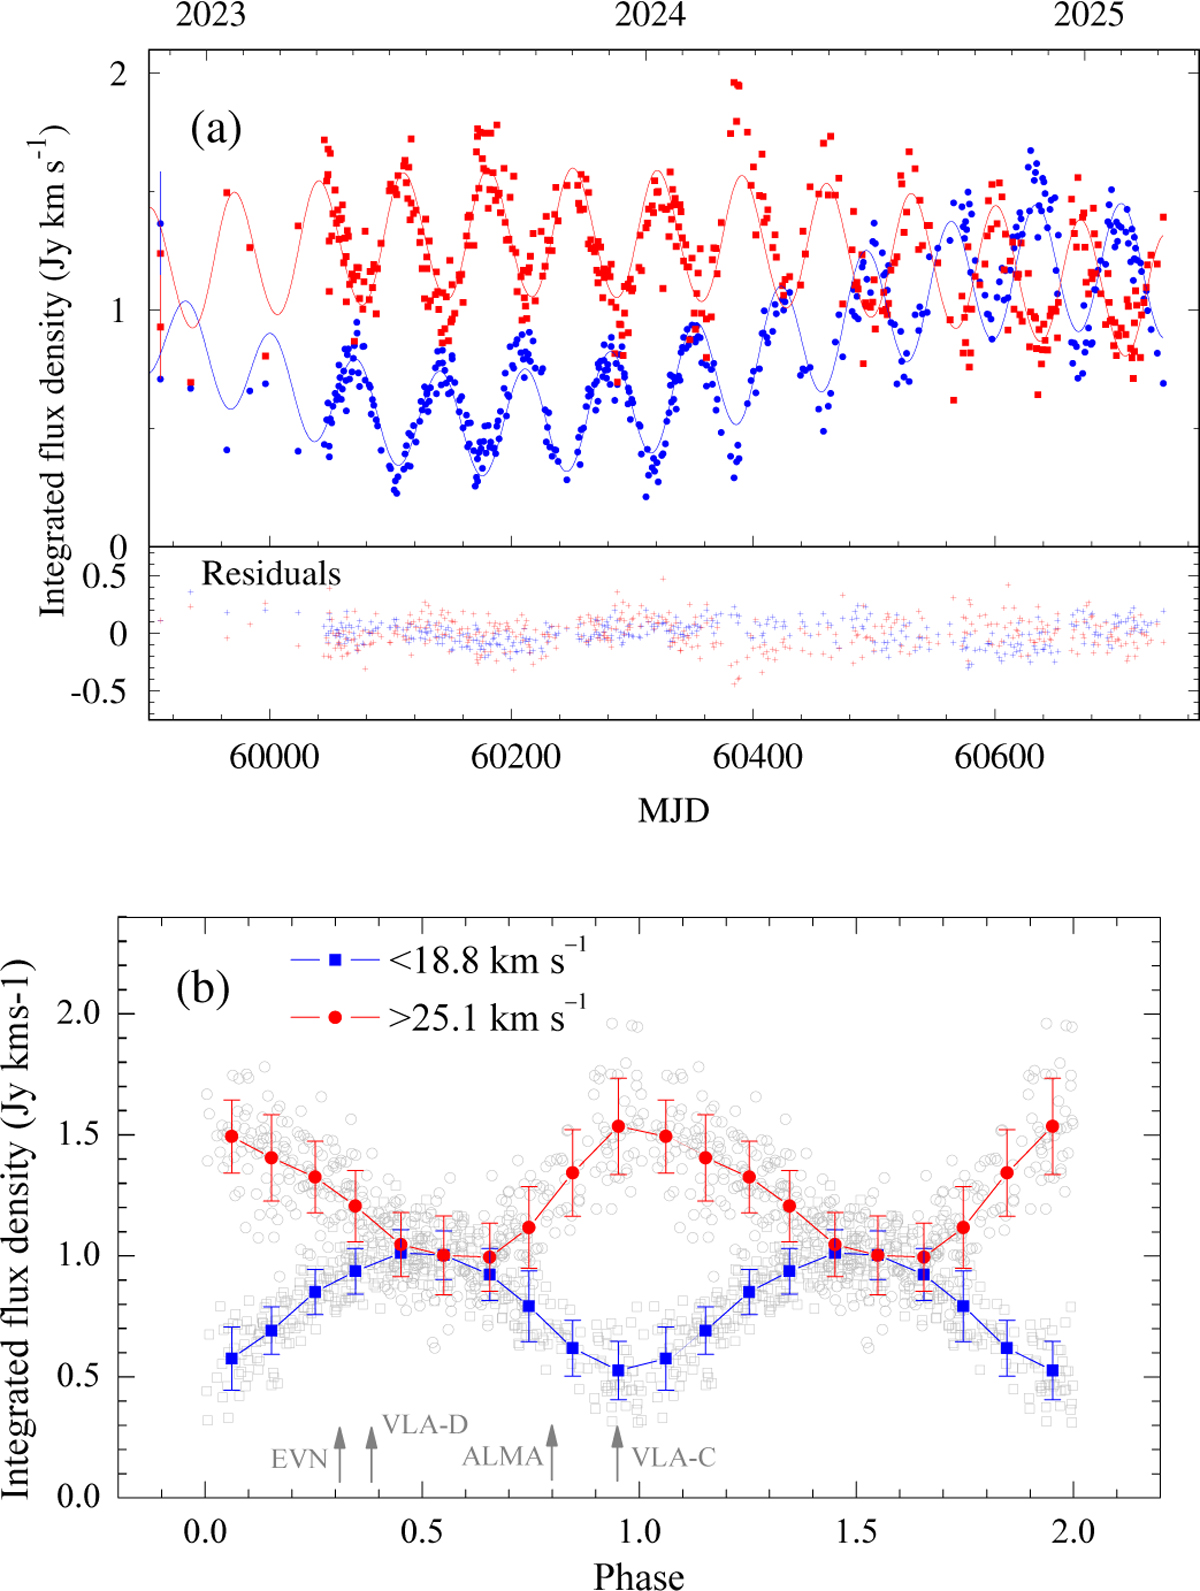
(a) Zoomed-in view of the light curves from Fig. 1 during the high-cadence observations (MJD 60045-60739). (b) Time series of the integrated emission at a velocity lower than 18.8 km s−1 (squares) and higher than 25.1 km s−1 (circles) folded modulo 70.1 d. The filled symbols represent data binned with a 0.1 phase increment. The bars denote the standard deviation. The gray arrows mark the phase of EVN (Bartkiewicz et al. 2009), VLA-C (Hu et al. 2016), VLA-D (Nguyen et al. 2022) and ALMA observations.
Current usage metrics show cumulative count of Article Views (full-text article views including HTML views, PDF and ePub downloads, according to the available data) and Abstracts Views on Vision4Press platform.
Data correspond to usage on the plateform after 2015. The current usage metrics is available 48-96 hours after online publication and is updated daily on week days.
Initial download of the metrics may take a while.