Fig. 3
Download original image
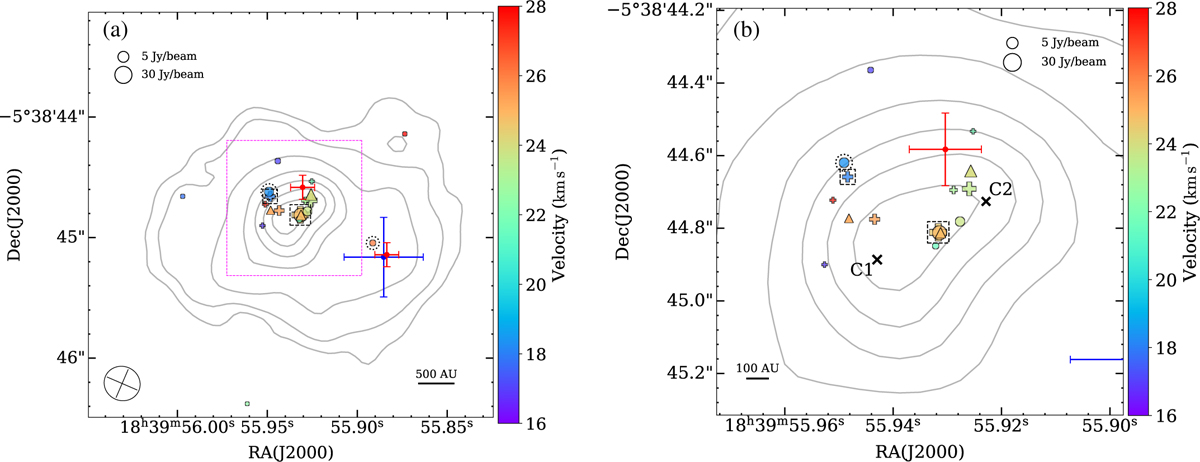
(a) Spatial distribution of centroids of 6.7 GHz methanol maser cloudlets overlaid with the 1.3 mm ALMA continuum. EVN (Bartkiewicz et al. 2009), VLA-D (Nguyen et al. 2022), and VLA-C (Hu et al. 2016) data are denoted with triangles, circles and crosses, respectively. The two crosses highlighted by dashed squares and two circle symbols surrounded by dotted circles indicate the strongest well-separated components in the spectrum, which exhibit periodic anticorrelated emission. The size of the symbol is proportional to the brightness of the cloudlet on a logarithmic scale, and its color represents the velocity shown by the wedges. The red and blue dots mark the positions with error bars of the 8.6 μm (Bartkiewicz et al. 2010) and 8.4 GHz (Bartkiewicz et al. 2009) sources, respectively. Contour levels are 3, 5, 10, 20, 30, 40, 50 times 1σrms of the 0.3 mJy beam−1. The synthesized beam is shown in the bottom left. (b) Magnified view of central region marked by the dashed magenta box in (a). Crosses labeled C1 and C2 represent the 1.3 mm continuum cores listed in Table 1.
Current usage metrics show cumulative count of Article Views (full-text article views including HTML views, PDF and ePub downloads, according to the available data) and Abstracts Views on Vision4Press platform.
Data correspond to usage on the plateform after 2015. The current usage metrics is available 48-96 hours after online publication and is updated daily on week days.
Initial download of the metrics may take a while.