Fig. A.1
Download original image
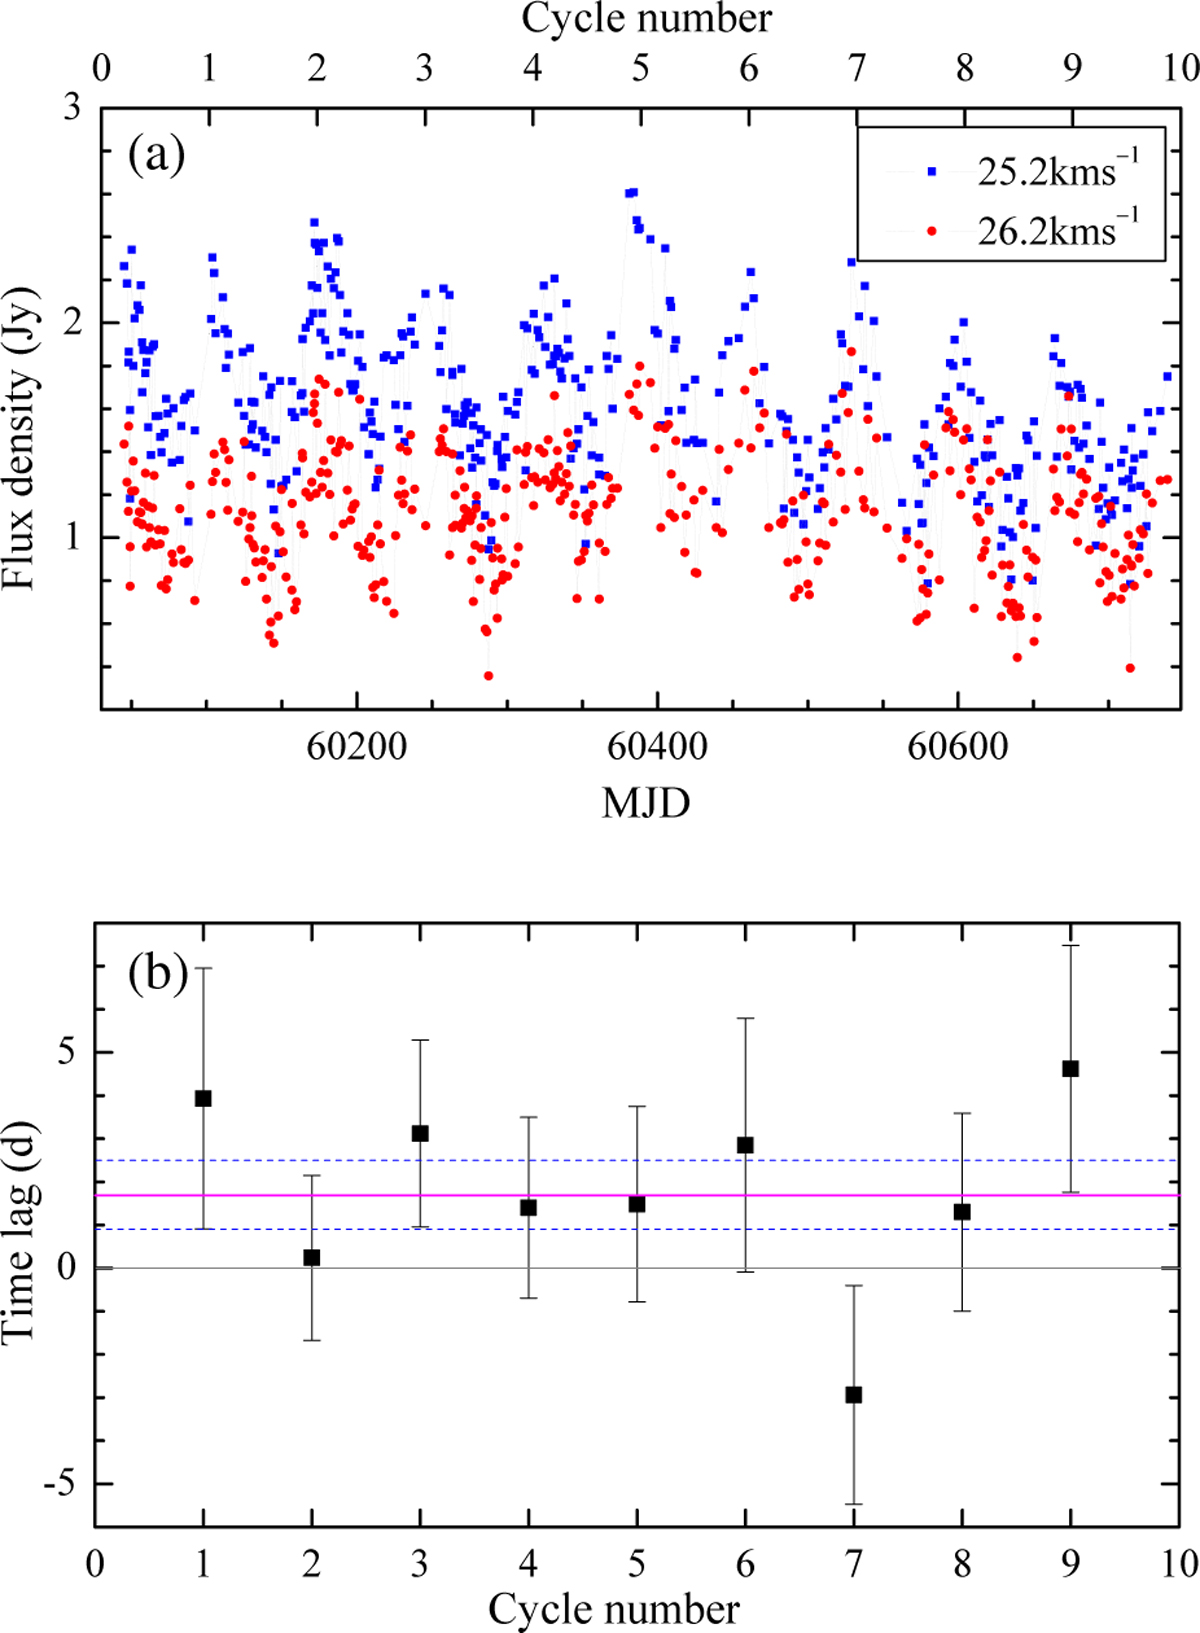
(a) Light curves of the redshifted spectral features for MJD 60045-60739. (b) Time lag of the maximum of 26.2 km s−1 feature relative to 25.2 km s−1 feature for subsequent cycles. The error bars indicate the standard deviation of the data fit with the sine function. The mean lag is marked with the magenta line, and the dotted blue lines show the standard error.
Current usage metrics show cumulative count of Article Views (full-text article views including HTML views, PDF and ePub downloads, according to the available data) and Abstracts Views on Vision4Press platform.
Data correspond to usage on the plateform after 2015. The current usage metrics is available 48-96 hours after online publication and is updated daily on week days.
Initial download of the metrics may take a while.