Open Access
Fig. A.2
Download original image
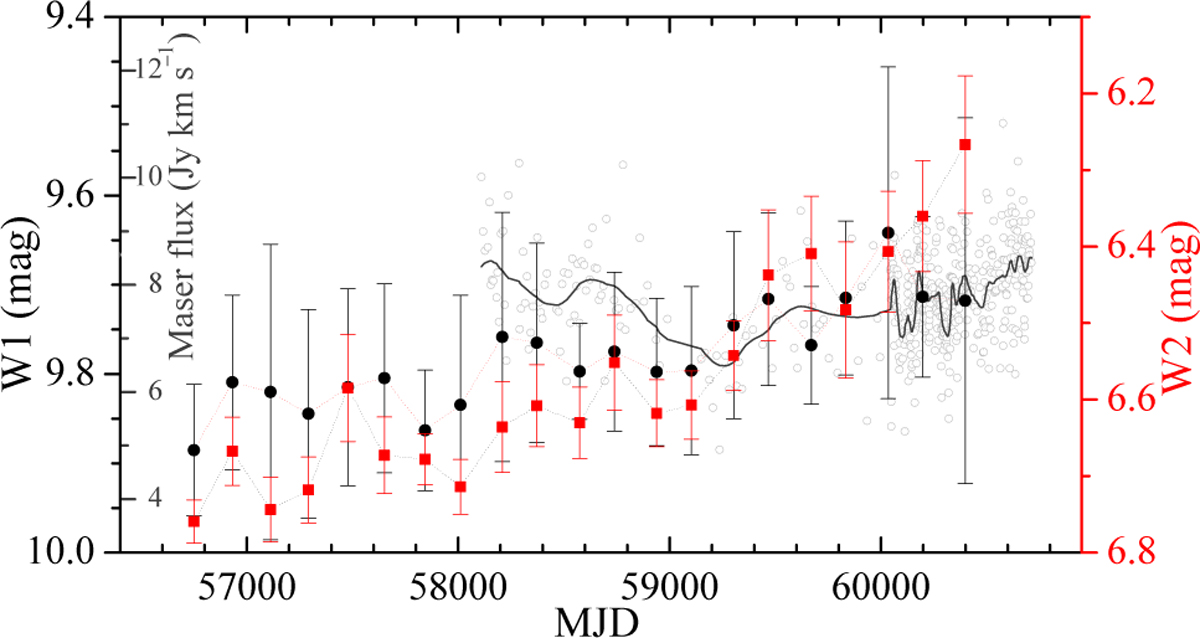
6.7 GHz maser velocity-integrated flux density (grey labels and circles) of G26 superimposed with the 3.4 μm (W1) and 4.6 μm (W2) NEOWISE light curves. The average magnitudes are shown for 21 NEOWISE epochs, and the bars denote the standard deviation. The dark grey line shows the average maser light curves.
Current usage metrics show cumulative count of Article Views (full-text article views including HTML views, PDF and ePub downloads, according to the available data) and Abstracts Views on Vision4Press platform.
Data correspond to usage on the plateform after 2015. The current usage metrics is available 48-96 hours after online publication and is updated daily on week days.
Initial download of the metrics may take a while.