Fig. A.3
Download original image
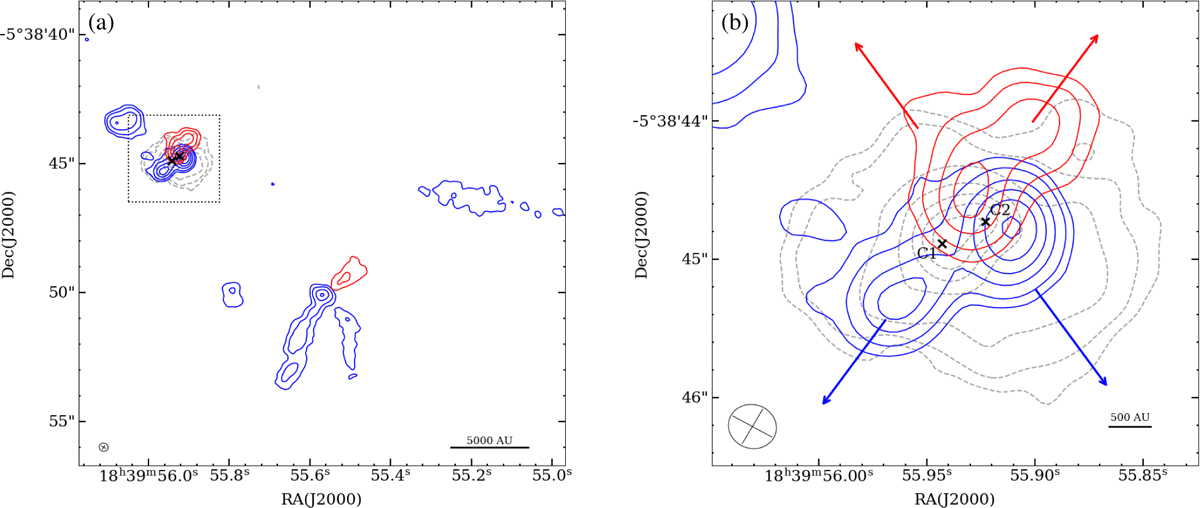
(a) Overview of superposition of the 1.3 mm continuum (grey dashed contours) and CO (2-1) blueshifted and redshifted (blue and red contours, respectively) emission toward G26. Contours are 3, 5, 10, 20, 30, 40, 50 × 1σrms of 0.3 mJy beam−1 for the continuum and 5, 10, 20, 30, 40, 50, 55 × 1σrms of 3.0 mJy beam−1 for CO. The redshifted and blueshifted emissions are integrated between 37 and 46 km s−1 and between 7 and 17 km s−1 with respect to the systemic velocity of 24.4 km s−1, respectively. The dashed square marks the region enlarged in (b). The crosses represent the cores labelled with C 1 and C 2, whose parameters are listed in Table 1. The blue and red arrows correspond to tentative directions of bipolar blueshifted and redshifted molecular outflows. The synthesized beam is shown in the bottom left for both images.
Current usage metrics show cumulative count of Article Views (full-text article views including HTML views, PDF and ePub downloads, according to the available data) and Abstracts Views on Vision4Press platform.
Data correspond to usage on the plateform after 2015. The current usage metrics is available 48-96 hours after online publication and is updated daily on week days.
Initial download of the metrics may take a while.