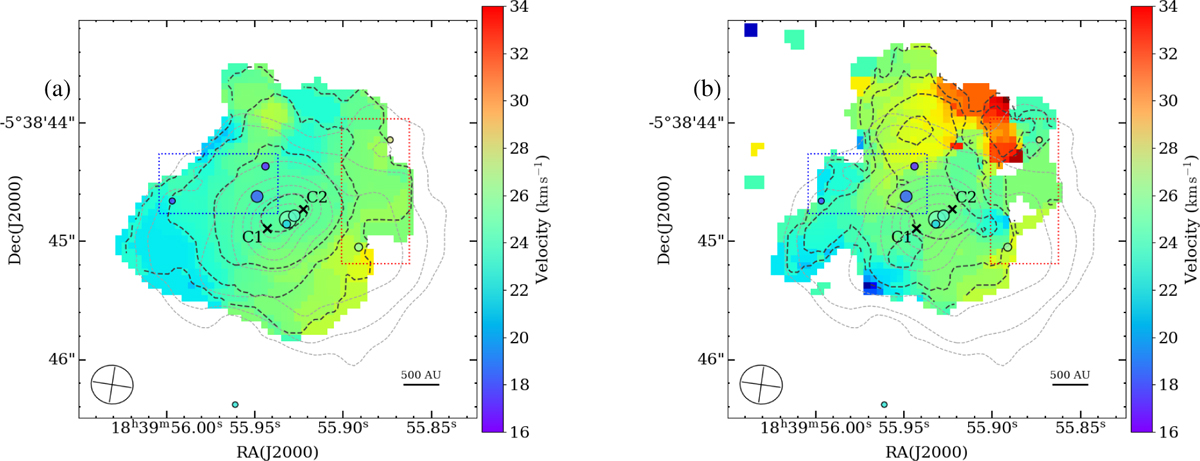
Fig. A.4
Download original image
Moment 0 (dashed black contour) and 1 (color scale) maps of the CH3OH 218.440 GHz (a) and SiO 217.205 GHz (b). The 1.3 mm continuum emission is shown with the grey dashed contours of the same levels as in Fig. A.3. The contours for CH3OH and SiO are 5, 15, 30, 90 times 1σrms of 11.70 mJy beam−1 km s−1 and 3, 7, 15, 30 times 1σrms of 15.49 mJy beam−1 km s−1, respectively. The maser cloudlets taken from Nguyen et al. (2022) are represented with circles whose sizes are proportional to the logarithm of brightness and colors scale to the velocity shown by the wedges. The cloudlets are grouped by colored, dashed boxes corresponding to the BS and RS emission, showing periodic anticorrelated variability, as defined in Sect. 3. The synthesized beam is shown in the bottom left for both images.
Current usage metrics show cumulative count of Article Views (full-text article views including HTML views, PDF and ePub downloads, according to the available data) and Abstracts Views on Vision4Press platform.
Data correspond to usage on the plateform after 2015. The current usage metrics is available 48-96 hours after online publication and is updated daily on week days.
Initial download of the metrics may take a while.