Fig. 1
Download original image
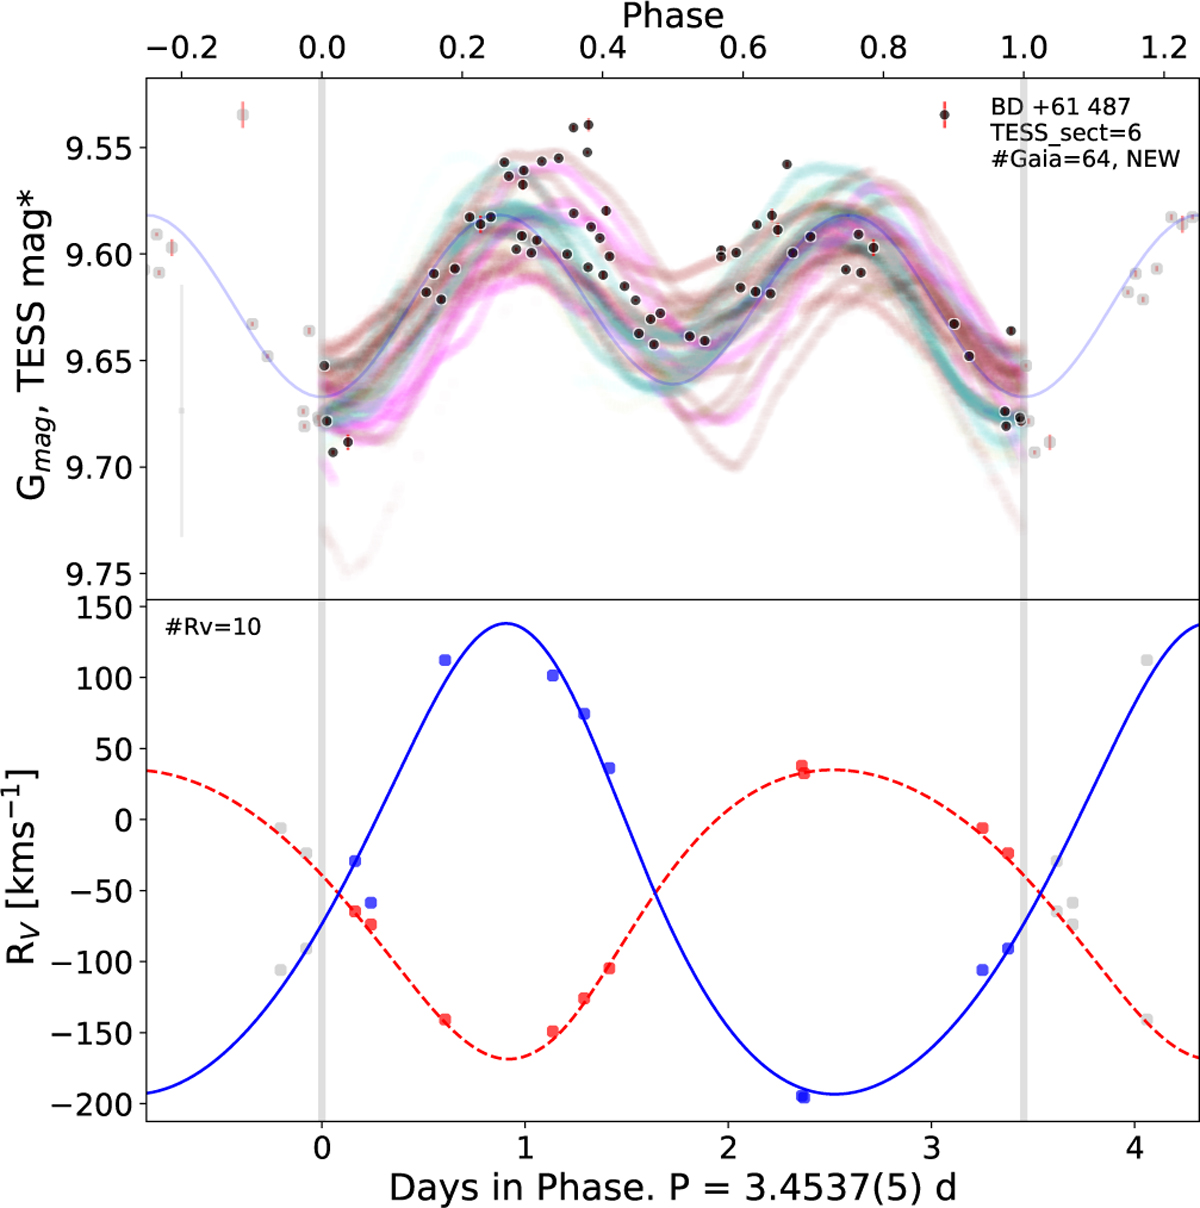
(Top) Folded light curve of Gaia G magnitude data and TESS available sectors for BD +61 487. In black Gaia is epoch-photometry and in light colors are the different sectors of TESS. Gaia Observations (black dots) include uncertainties in red. The gray point with uncertainty in the corner marks the typical error for TESS magnitudes considering the zero point uncertainty. The orbital PHOEBE model obtained for the set of points is included in light blue. In gray are repeated points beyond the central period. The number of Gaia points, TESS available sectors, and status are indicated in the figure. (Bottom) Spectroscopic orbit with radial velocity measurements for the primary and secondary, and the number of spectra used. The lines come from the PHOEBE model.
Current usage metrics show cumulative count of Article Views (full-text article views including HTML views, PDF and ePub downloads, according to the available data) and Abstracts Views on Vision4Press platform.
Data correspond to usage on the plateform after 2015. The current usage metrics is available 48-96 hours after online publication and is updated daily on week days.
Initial download of the metrics may take a while.