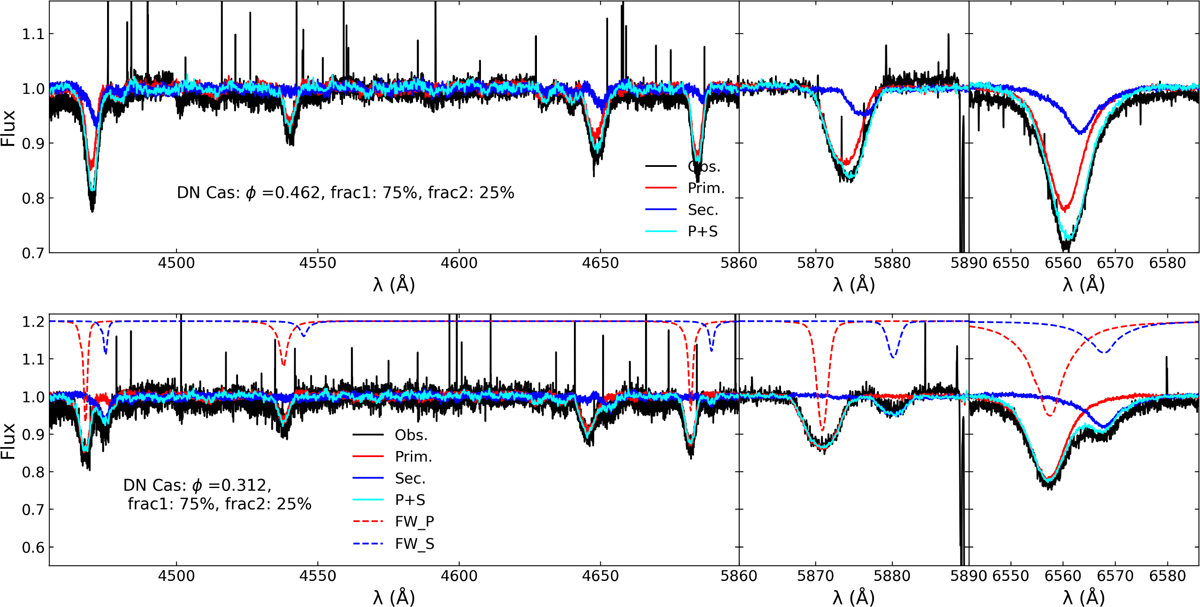
Fig. A.14
Download original image
Same as Fig. 4 for DN Cas. This plot also includes synthetic atmosphere models computed with FASTWIND, employed to confirm via cross-correlation analysis that the spectral line shifts in the disentangled spectra are in excellent agreement with those of the models. The FASTWIND model is shifted for clarity, and computed with low rotational broadening to highlight the core position of the lines. The model includes only H and He lines.
Current usage metrics show cumulative count of Article Views (full-text article views including HTML views, PDF and ePub downloads, according to the available data) and Abstracts Views on Vision4Press platform.
Data correspond to usage on the plateform after 2015. The current usage metrics is available 48-96 hours after online publication and is updated daily on week days.
Initial download of the metrics may take a while.