Fig. 1
Download original image
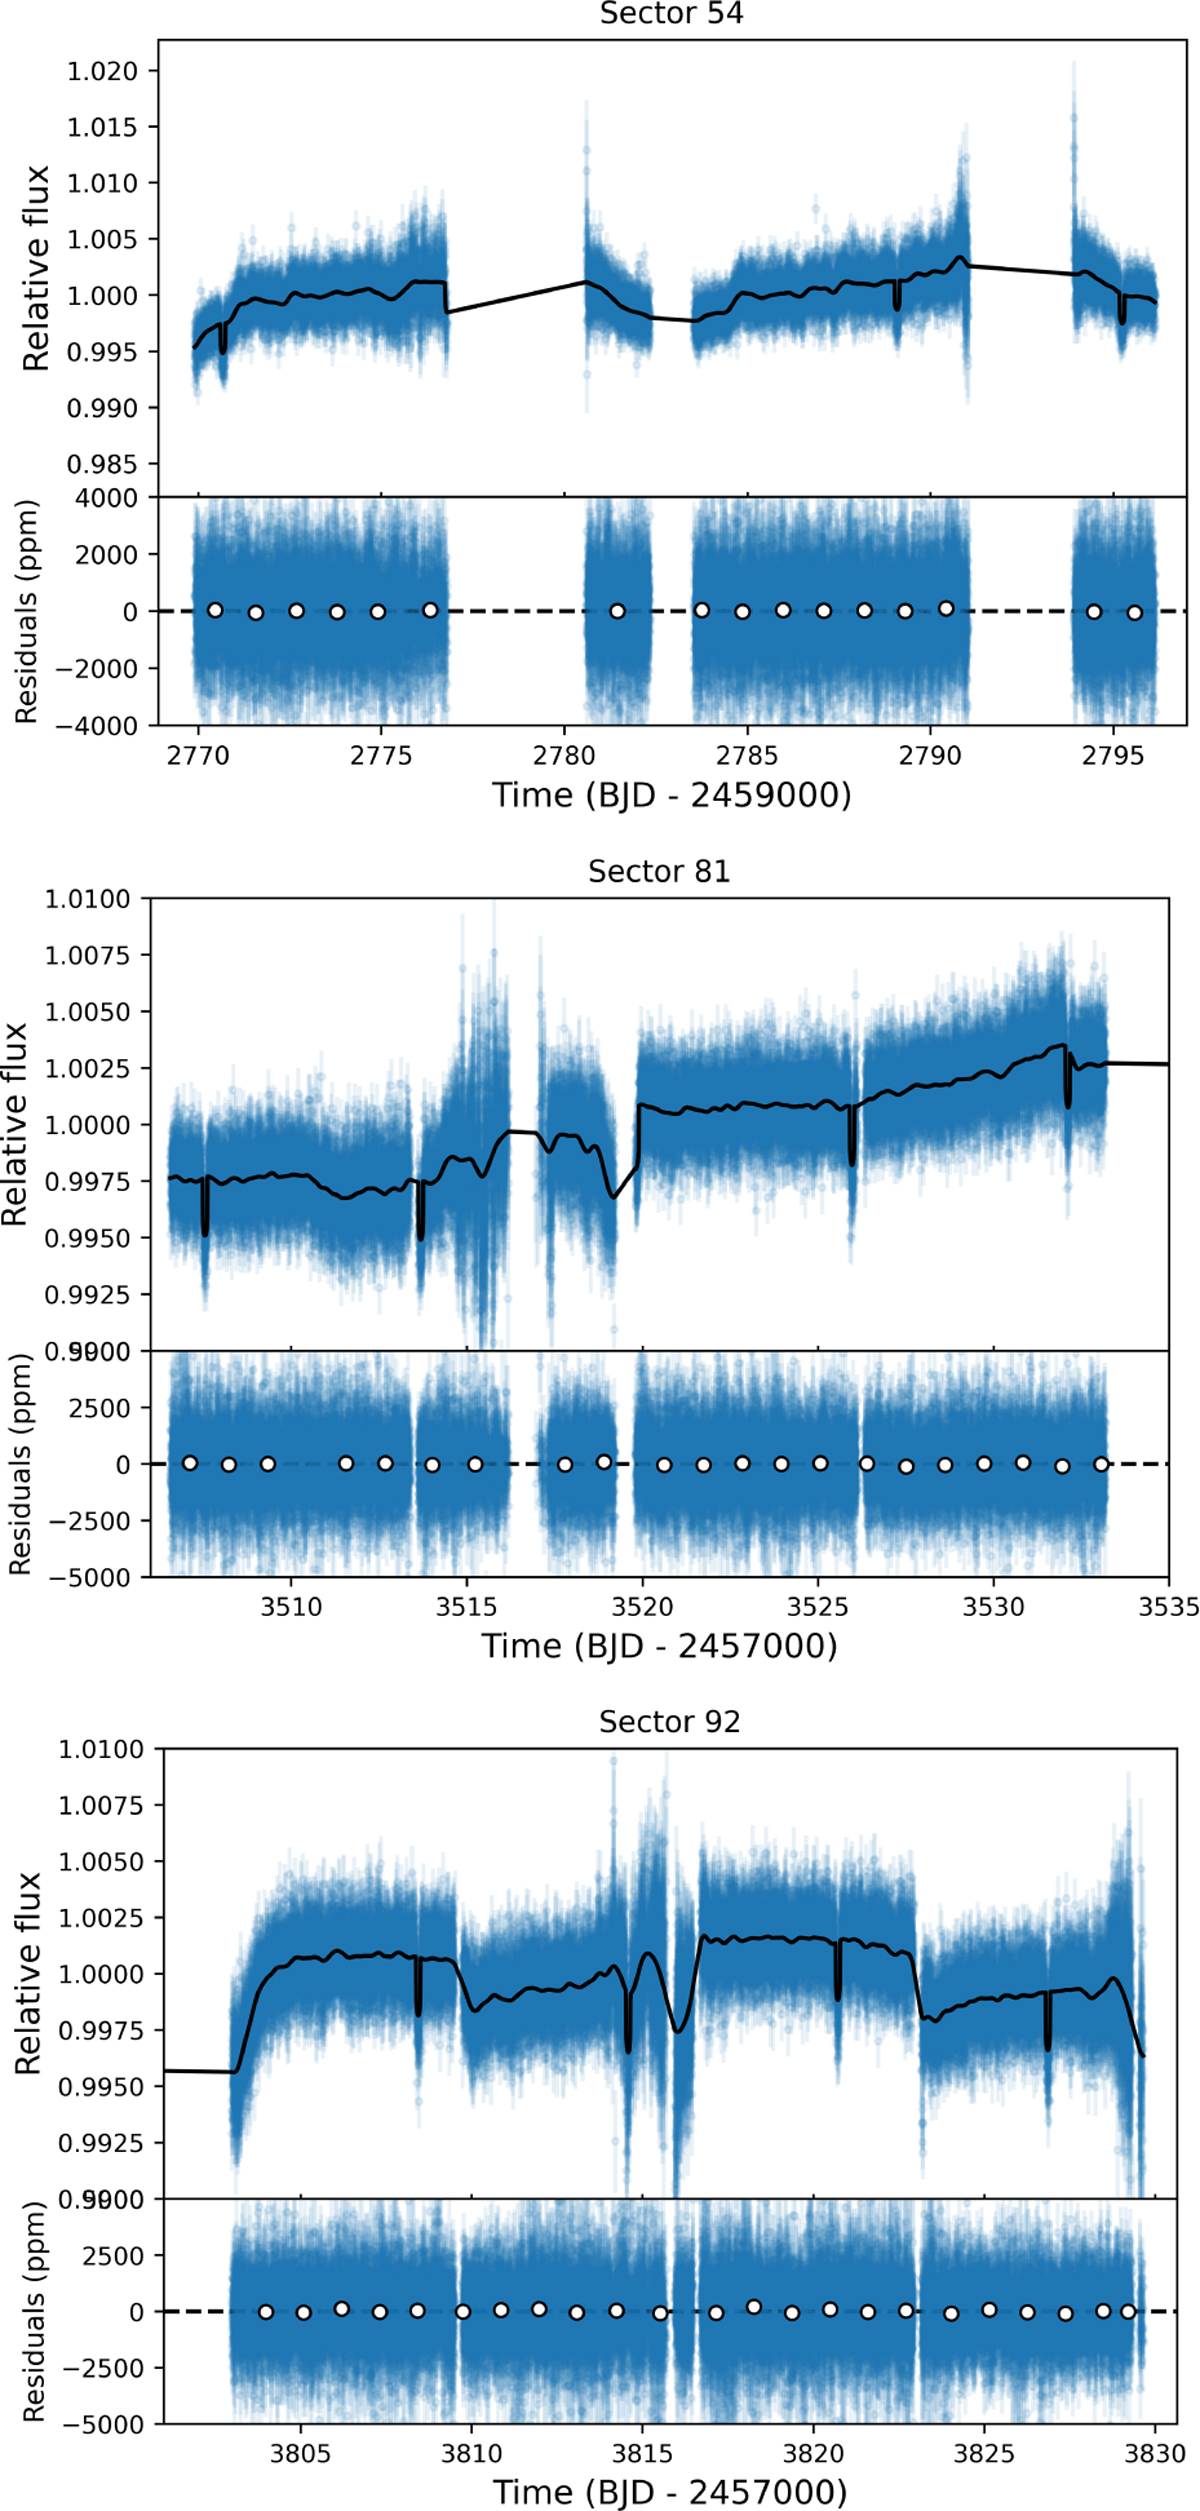
Light curve of TOI-5795 obtained by TESS by monitoring Sectors 54 (top panel), 81 (middle panel), and 92 (bottom panel) at a 2-min cadence, extracted using the SAP pipeline. No significant rotational modulation is detected. The black line represents our best-fit transit model, while the white points are binned data. The residuals of the best-fit model are shown in parts per million in all panels.
Current usage metrics show cumulative count of Article Views (full-text article views including HTML views, PDF and ePub downloads, according to the available data) and Abstracts Views on Vision4Press platform.
Data correspond to usage on the plateform after 2015. The current usage metrics is available 48-96 hours after online publication and is updated daily on week days.
Initial download of the metrics may take a while.