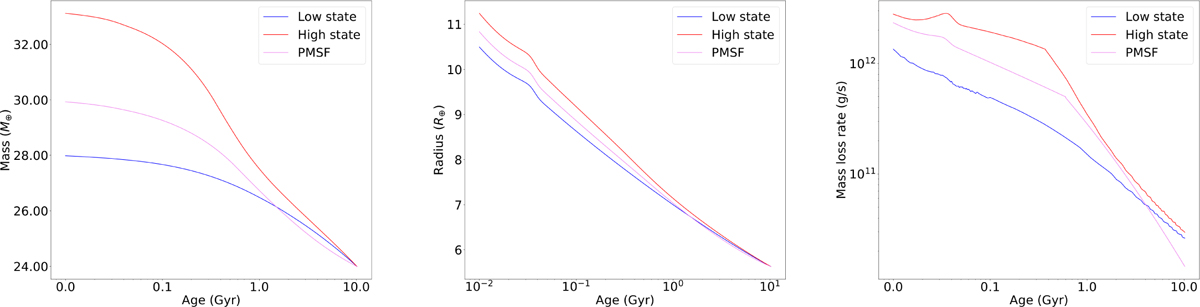
Fig. 13
Download original image
Temporal evolution of mass, radius, and mass-loss rate of TOI-5795 b. The left, middle and right panels show the evolution of planetary mass, radius, and mass-loss rate, respectively. Colours indicate different high-energy evolutionary tracks: the blue line refers to the low state (lowest 2% percentile of the activity distribution), the red line refers to the high state (2% percentile), and the pink line refers to PMSF (based on the X-ray luminosity evolution of Penz & Micela 2008, combined with the X-ray to EUV conversion from Sanz-Forcada et al. 2025).
Current usage metrics show cumulative count of Article Views (full-text article views including HTML views, PDF and ePub downloads, according to the available data) and Abstracts Views on Vision4Press platform.
Data correspond to usage on the plateform after 2015. The current usage metrics is available 48-96 hours after online publication and is updated daily on week days.
Initial download of the metrics may take a while.