Open Access
Fig. 2
Download original image
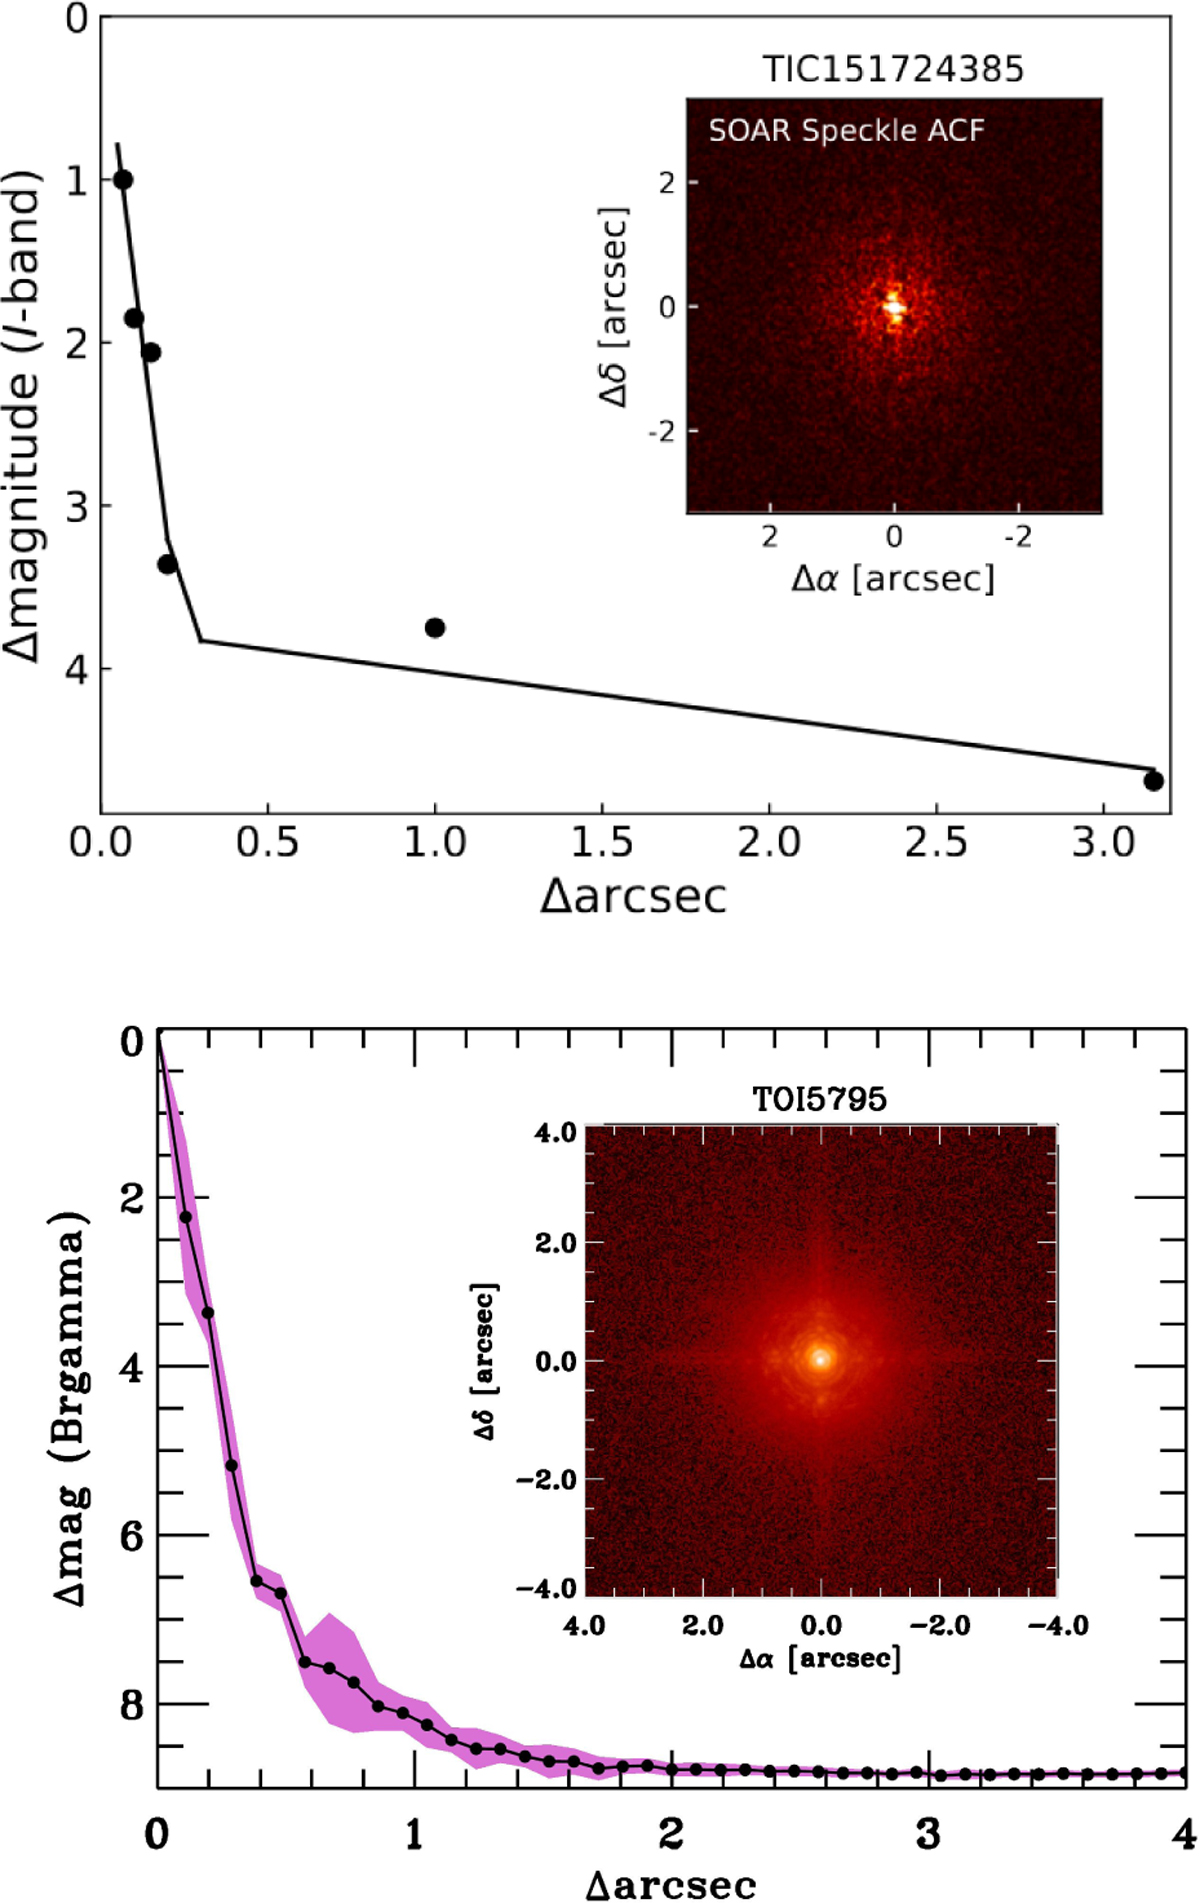
High-resolution sensitivity curves for SOAR (top panel) and the Palomar Hale telescope (bottom panel), plotted as a function of angular separation from the host star. Insets in the respective panels show images of the central region of the data.
Current usage metrics show cumulative count of Article Views (full-text article views including HTML views, PDF and ePub downloads, according to the available data) and Abstracts Views on Vision4Press platform.
Data correspond to usage on the plateform after 2015. The current usage metrics is available 48-96 hours after online publication and is updated daily on week days.
Initial download of the metrics may take a while.