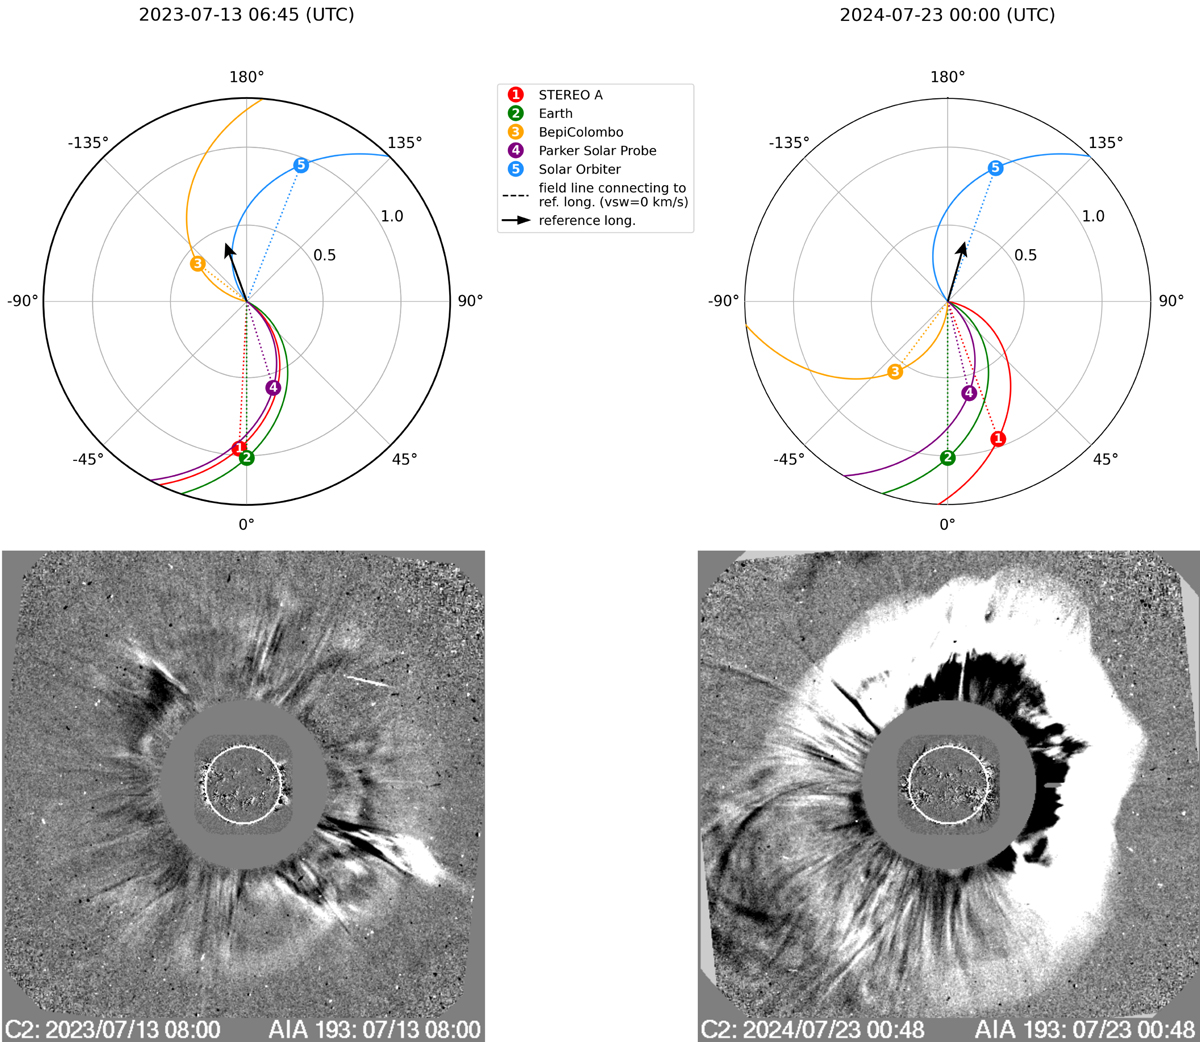
Fig. 1.
Download original image
Upper panels: Positions of the spacecraft during events 1 and 2 from Solar-MACH (Gieseler et al. 2023). The location of Solar Orbiter is indicated by a blue dot. The arrow shows the direction of the associated solar flare. The Parker spiral magnetic field line corresponds to an assumed solar wind speed of 400 km/s. Lower panels: Corresponding halo CMEs observed by the LASCO-C2 coronagraph on board SOHO for both events.
Current usage metrics show cumulative count of Article Views (full-text article views including HTML views, PDF and ePub downloads, according to the available data) and Abstracts Views on Vision4Press platform.
Data correspond to usage on the plateform after 2015. The current usage metrics is available 48-96 hours after online publication and is updated daily on week days.
Initial download of the metrics may take a while.