Fig. 2.
Download original image
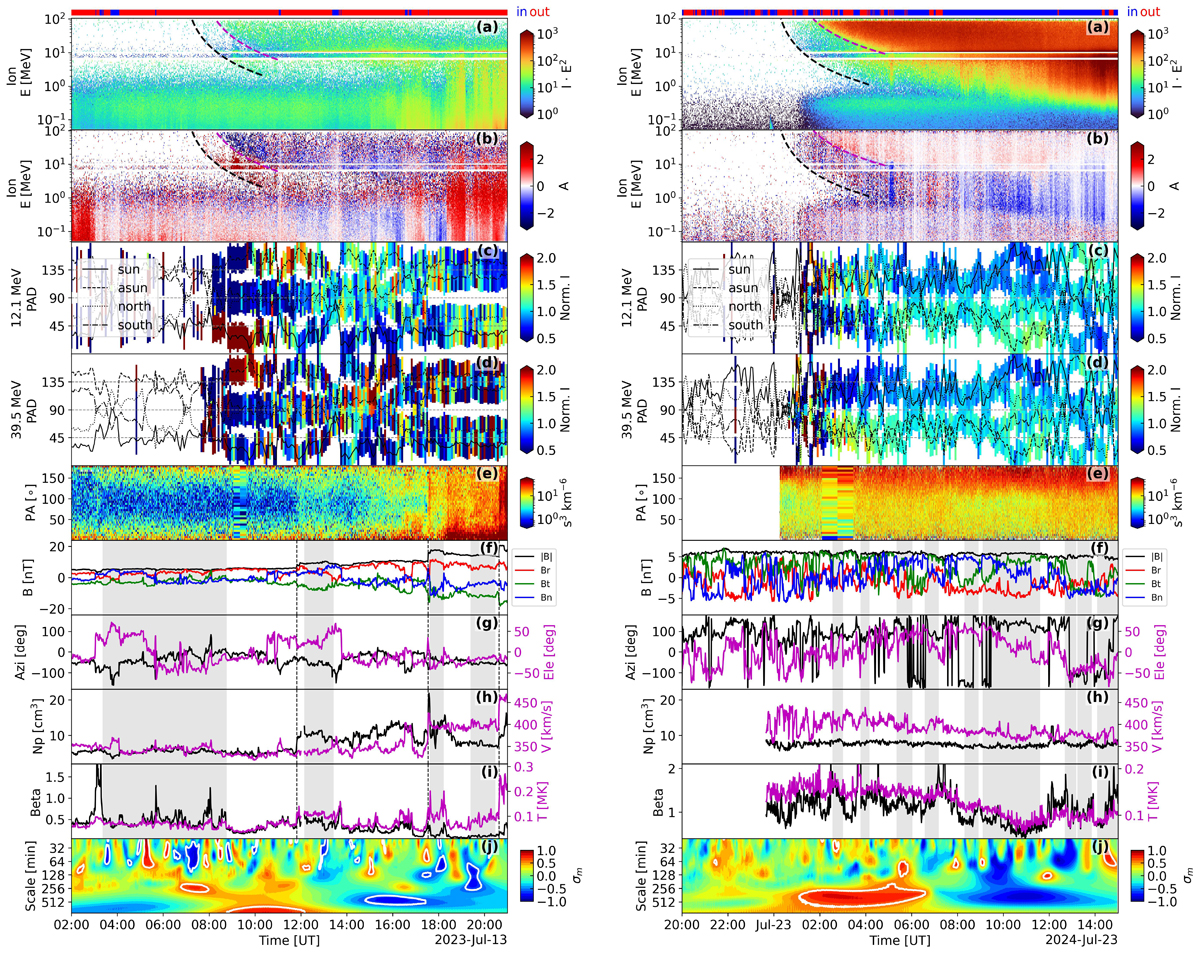
Overview of SEP events 1 (left) and 2 (right). The top horizontal bars show the in situ magnetic field polarity, with red (blue) indicating a magnetic field direction outwards from (inwards towards) the Sun. Panels a: Omnidirectional proton dynamic spectra measured by EPT and HET. The colour-coded bins represent scaled intensity I ⋅ E2 in units of cm−2 s−1 sr−1 MeV. Panels b: First-order anisotropy of protons. Panels c: Pitch angle distribution (PAD) of 12.1 MeV protons measured by the four HET telescopes. Panels d: PAD of 39.5 MeV protons. Panels e: PAD of > 70 eV suprathermal electrons measured by SWA/EAS. Panels f: Magnetic field strength in RTN coordinates. Panels g: Azimuthal and elevation angles of the magnetic field. Panels h: Proton number density and bulk solar wind speed. Panels i: Plasma beta and proton temperature. Panels j: Normalized reduced magnetic helicity, with white contours indicating regions where |σm|> 0.6. The vertical dashed lines mark the locations of interplanetary shocks, and the grey-shaded area denotes the intervals of the SFRs.
Current usage metrics show cumulative count of Article Views (full-text article views including HTML views, PDF and ePub downloads, according to the available data) and Abstracts Views on Vision4Press platform.
Data correspond to usage on the plateform after 2015. The current usage metrics is available 48-96 hours after online publication and is updated daily on week days.
Initial download of the metrics may take a while.