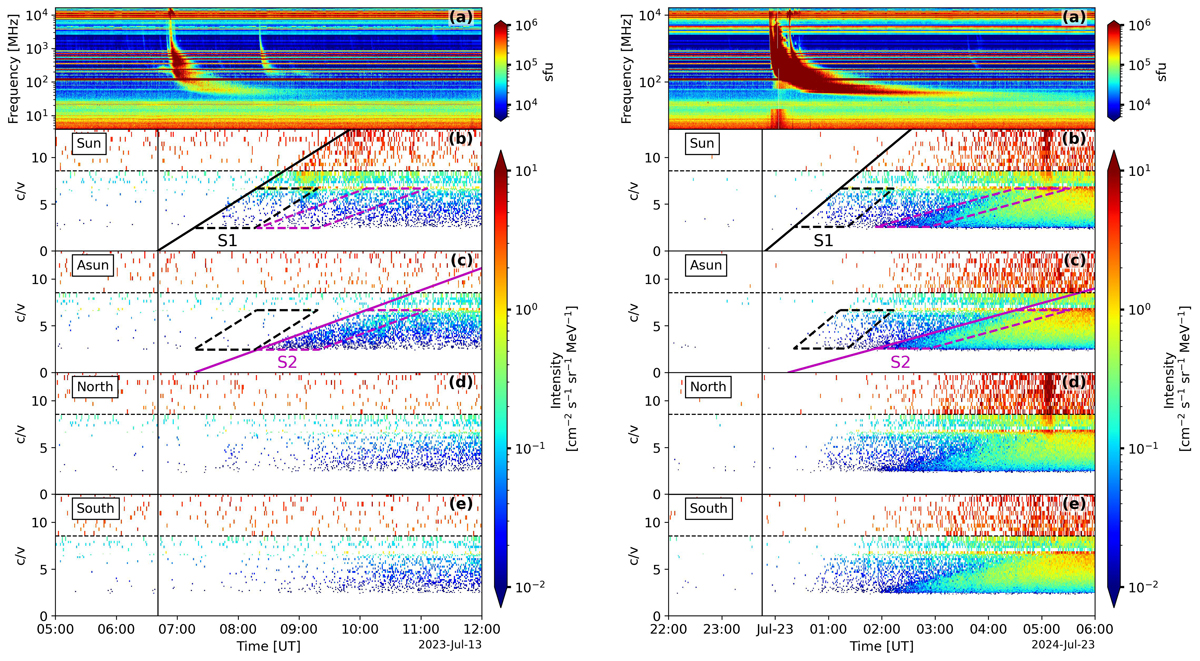
Fig. 3.
Download original image
Top panel: Radio dynamic spectrum observed by SolO/RPW. Lower four panels: Proton intensity as a function of inverse beta (c/v, where c is the speed of light and v is the particle velocity) and time for the sunward, anti-sunward, north, and south telescopes of both EPT and HET. The vertical line marks the onset time of the radio burst, which has been shifted 7.9 and 7.2 minutes earlier to facilitate comparison with the particle release time for event 1 and event 2. The horizontal dashed black line in each panel marks the boundary between the energy ranges of HET (below) and EPT (above). In panels b and c, the dashed black and magenta lines represent the fitted velocity dispersion tracks derived from the sunward and anti-sunward telescopes, respectively; the black and magenta boxes indicate the time intervals and energy ranges used for spectral integration within a 1-hour window (see Fig. 4 for details).
Current usage metrics show cumulative count of Article Views (full-text article views including HTML views, PDF and ePub downloads, according to the available data) and Abstracts Views on Vision4Press platform.
Data correspond to usage on the plateform after 2015. The current usage metrics is available 48-96 hours after online publication and is updated daily on week days.
Initial download of the metrics may take a while.