Open Access
Fig. 4.
Download original image
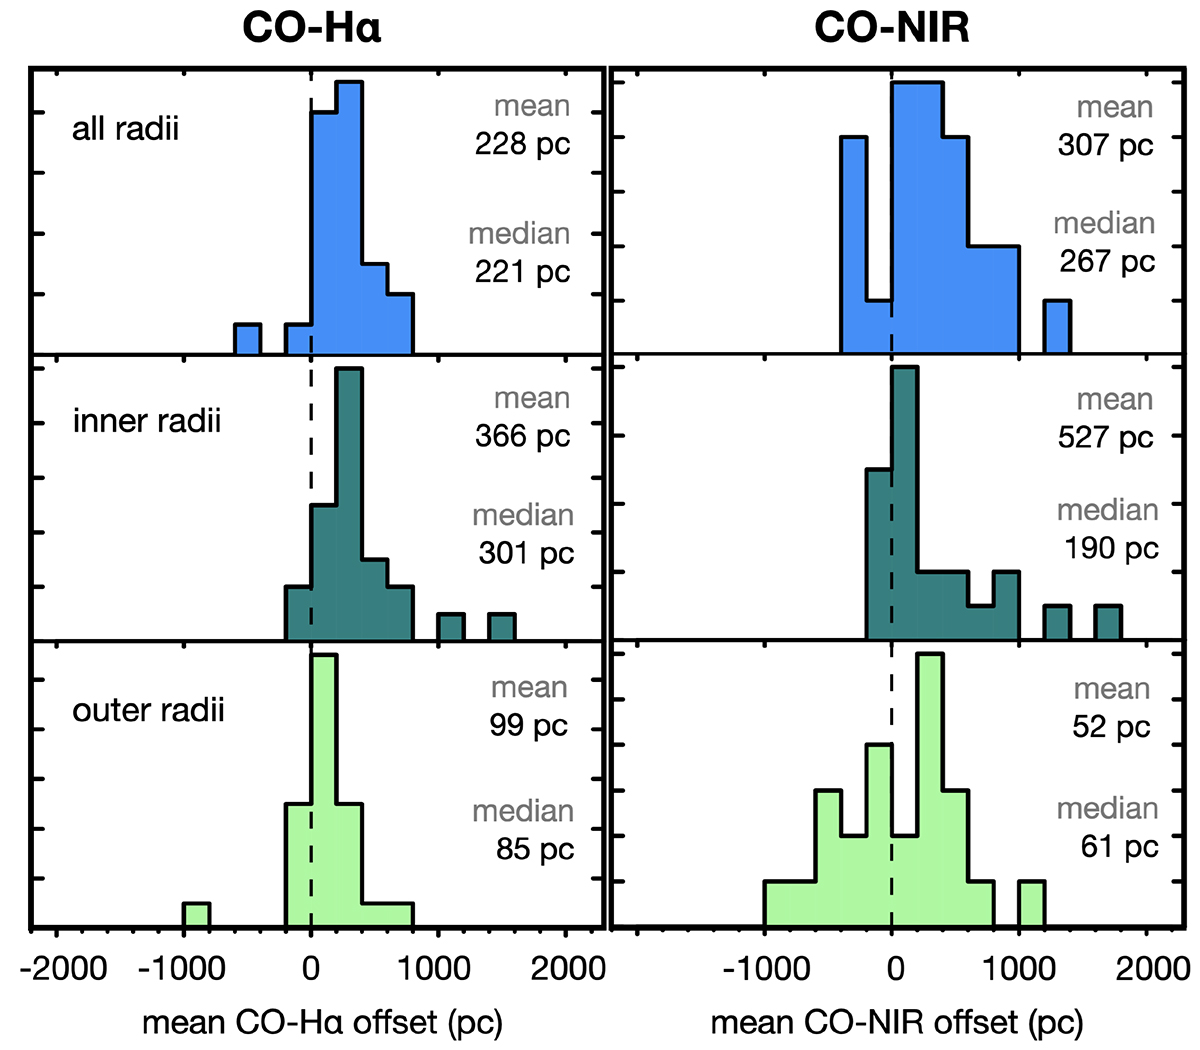
Histograms showing the distribution of the mean CO-Hα and CO-NIR offsets across the whole galaxy sample. Each histogram includes one mean offset per galaxy, computed by averaging all measured offsets for all radii (top), the inner half (middle, ![]() ), and the outer half (bottom,
), and the outer half (bottom, ![]() )).
)).
Current usage metrics show cumulative count of Article Views (full-text article views including HTML views, PDF and ePub downloads, according to the available data) and Abstracts Views on Vision4Press platform.
Data correspond to usage on the plateform after 2015. The current usage metrics is available 48-96 hours after online publication and is updated daily on week days.
Initial download of the metrics may take a while.