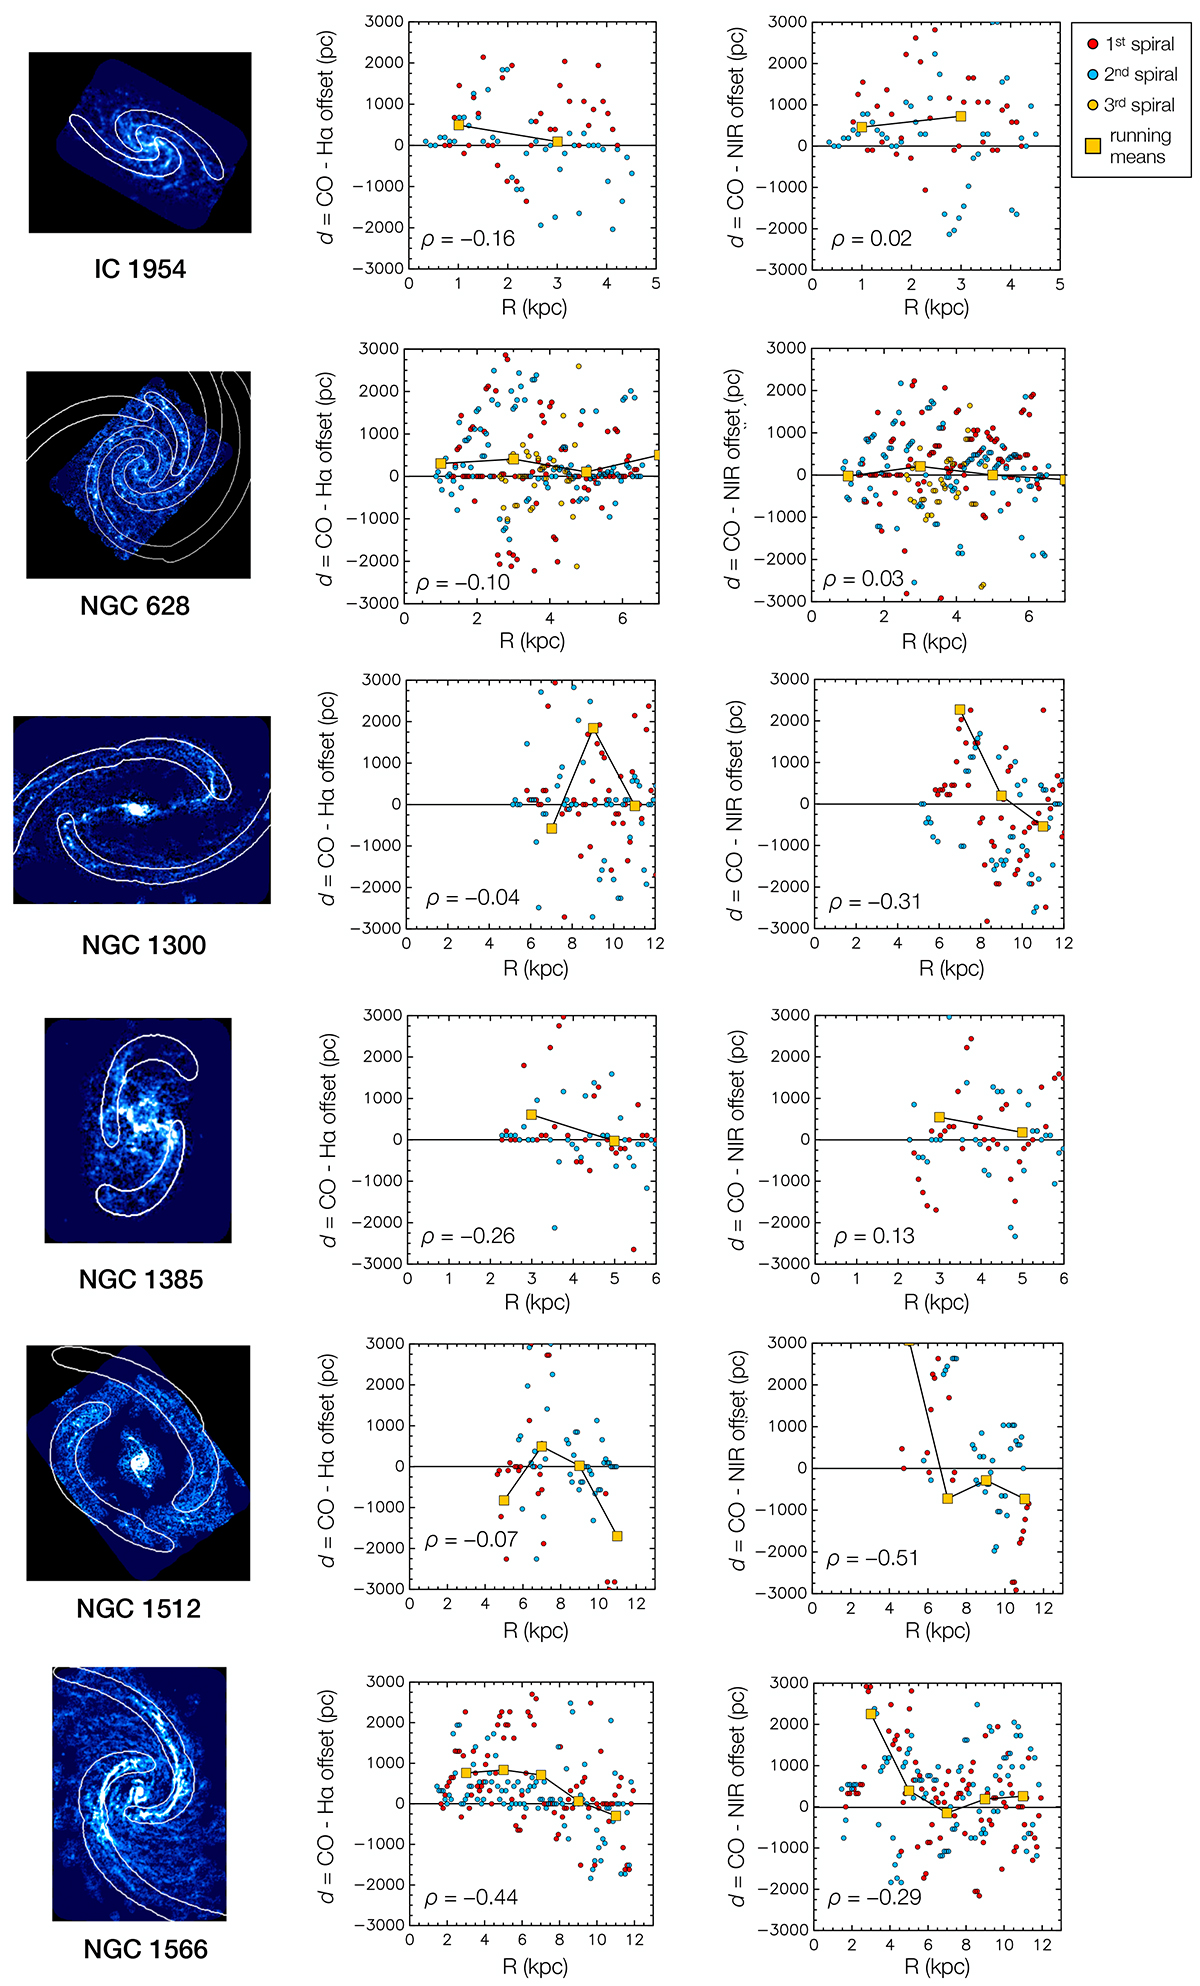
Fig. B.2.
Download original image
Atlas of the galaxies studied in this paper showing the CO(2-1) map from ALMA with the spiral masks on top. Middle panel: CO-Hα offsets in parsec as a function of radius. Right panel: Equivalent CO-NIR offsets. The error bars are comparable to the size of the plotted circles. The yellow squares joined by a line show the running means in radial steps of 2 kpc.
Current usage metrics show cumulative count of Article Views (full-text article views including HTML views, PDF and ePub downloads, according to the available data) and Abstracts Views on Vision4Press platform.
Data correspond to usage on the plateform after 2015. The current usage metrics is available 48-96 hours after online publication and is updated daily on week days.
Initial download of the metrics may take a while.