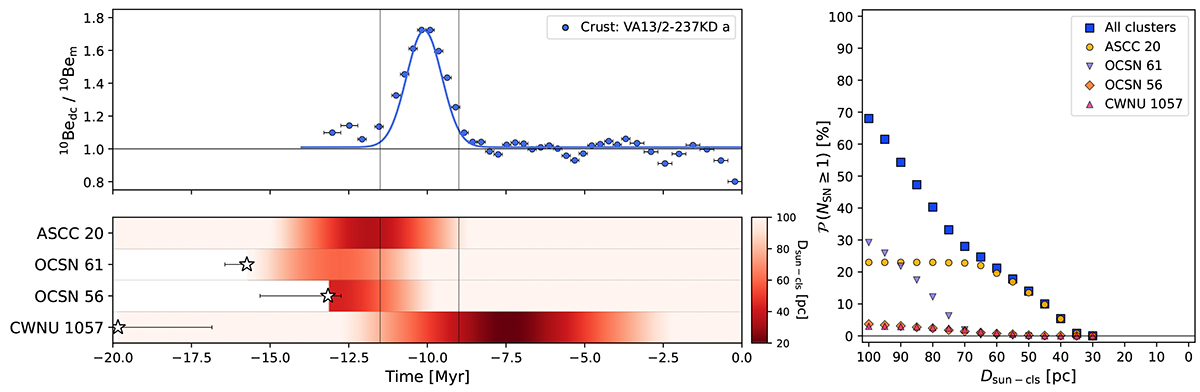
Fig. 1.
Download original image
Overview of the 10Be anomaly, clusters proximity to the Solar System, and the associated SN probability. Top left: 10Be decay corrected profile (10Bedc), normalized by the 10Be mean equilibrium surface concentration (10Bem), for the crust VA13/2-237KD-a, as reported in Fig. 4 of Koll et al. (2025) (kindly provided in a processed form by the authors upon request). A Gaussian centered at 10.1 Myr, with a full width at half maximum of 1.4 Myr, is overplotted in blue. The two vertical black lines mark the onset and end of the anomaly. Bottom left: Distance between the Sun and the four clusters discussed in Sect. 4 over the past 20 Myr. The color bar saturates at 100 pc, the threshold distance adopted in this work for the SN probability study. If a cluster formed within this time interval, its formation time is marked by a star, and an error bar indicates the associated uncertainty. Right: Probability of having at least one SN event between the onset and the peak of the anomaly (11.5–10.1 Myr ago) as a function of distance. The total probability for all clusters considered in this study, as well as for each of the four main clusters, is shown. Statistical errors for the data points are within 3%. The numerical values corresponding to this figure are reported in Table B.3.
Current usage metrics show cumulative count of Article Views (full-text article views including HTML views, PDF and ePub downloads, according to the available data) and Abstracts Views on Vision4Press platform.
Data correspond to usage on the plateform after 2015. The current usage metrics is available 48-96 hours after online publication and is updated daily on week days.
Initial download of the metrics may take a while.