Fig. D.1.
Download original image
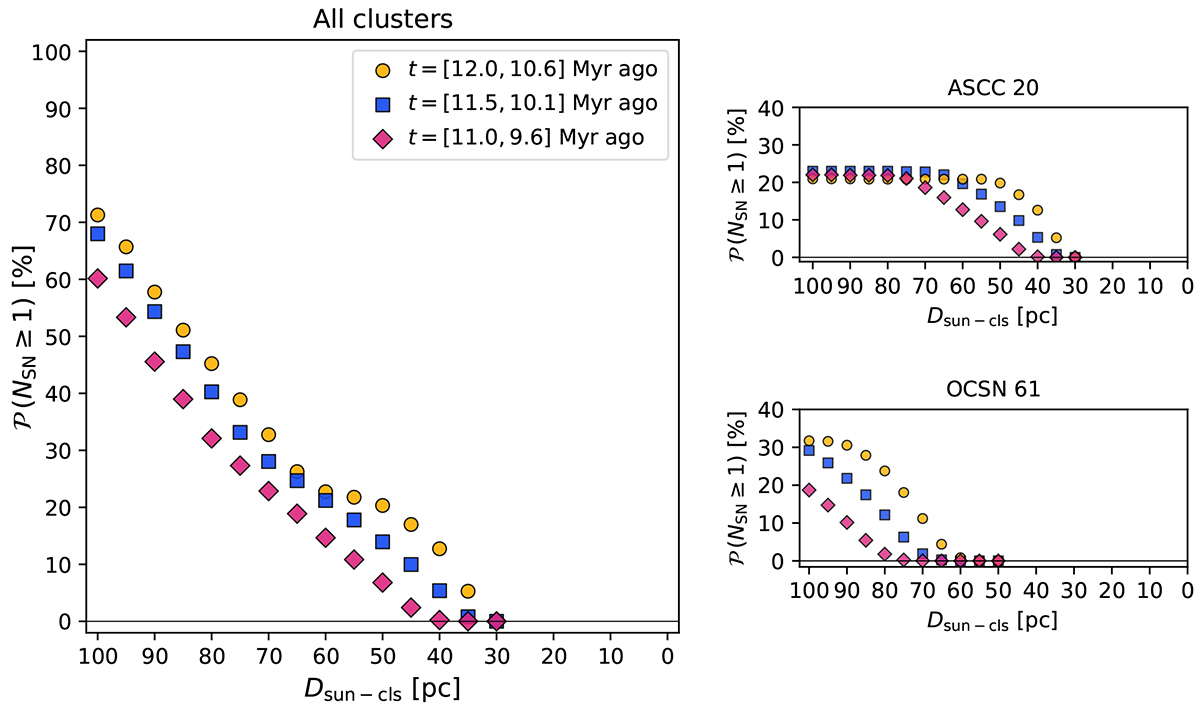
Probability of having at least one SN event as a function of distance, evaluated over three different 10Be anomaly time windows to assess the impact of systematic uncertainties on geological age dating. Blue squares correspond to the time window used in this study ([11.5, 10.1] Myr ago), based on Koll et al. (2025). Yellow circles represent the older time window ([12.0, 10.6] Myr ago), and purple diamonds the younger one ([11.0, 9.6] Myr ago). The left panel shows the total probability derived from all clusters. The right panel shows the probabilities for ASCC 20 (top) and OCSN 61 (bottom).
Current usage metrics show cumulative count of Article Views (full-text article views including HTML views, PDF and ePub downloads, according to the available data) and Abstracts Views on Vision4Press platform.
Data correspond to usage on the plateform after 2015. The current usage metrics is available 48-96 hours after online publication and is updated daily on week days.
Initial download of the metrics may take a while.