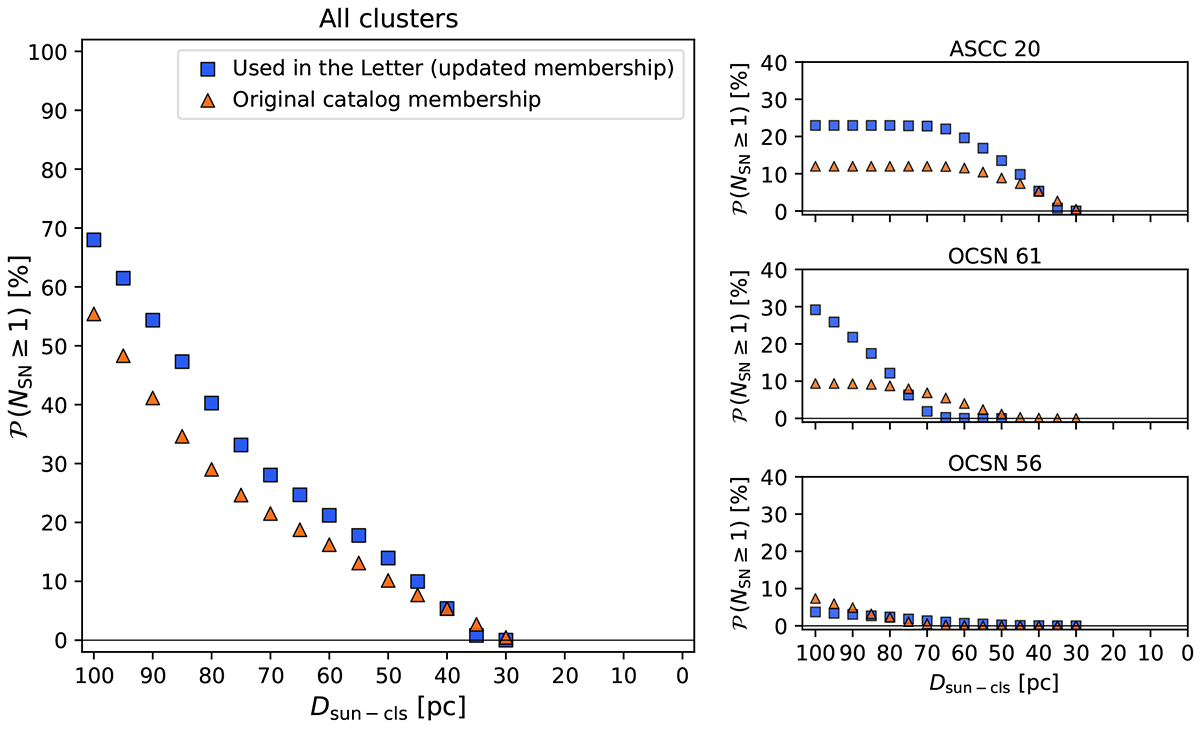
Fig. E.1.
Download original image
Comparison of the probability of having at least one SN event as a function of distance, between the case where the Orion clusters’ updated membership lists are used (main analysis; blue squares) and the case using the original memberships from Hunt & Reffert (2023) (orange triangles). The left panel shows the total probability from all clusters, while the right panel shows the probabilities for ASCC 20 (top), OCSN 61 (middle), and OCSN 56 (bottom).
Current usage metrics show cumulative count of Article Views (full-text article views including HTML views, PDF and ePub downloads, according to the available data) and Abstracts Views on Vision4Press platform.
Data correspond to usage on the plateform after 2015. The current usage metrics is available 48-96 hours after online publication and is updated daily on week days.
Initial download of the metrics may take a while.