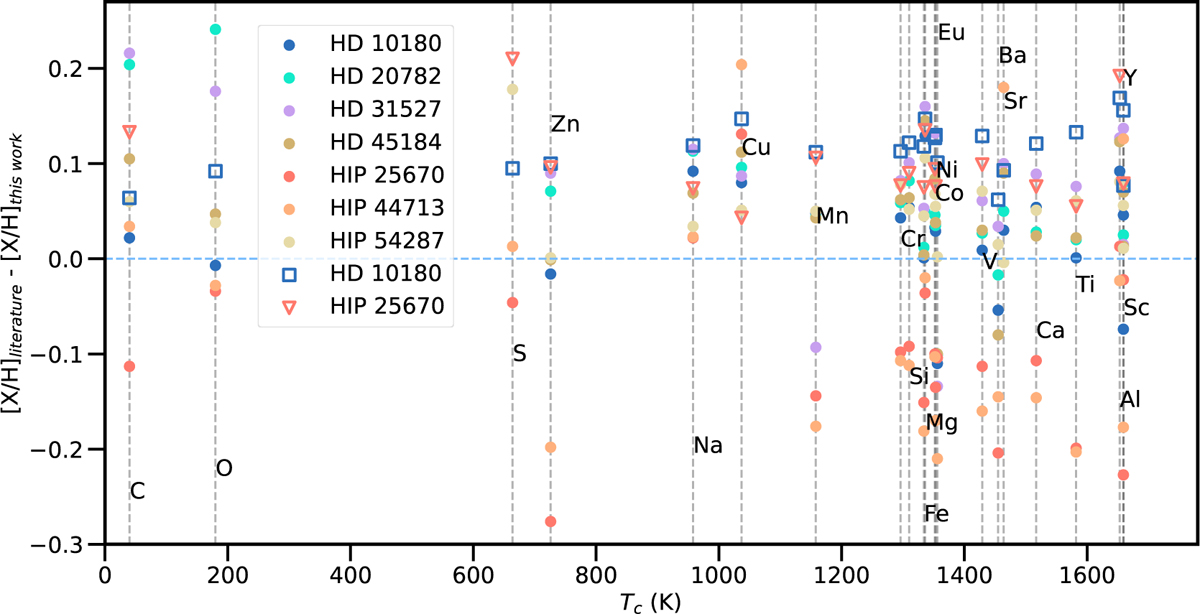
Fig. 1
Download original image
Comparison of elemental abundances from the literature and this work (filled circles) for the same stars. The y-axis shows the difference in abundance, [X/H]literature – [X/H]this work, plotted against the Tc of each element on the x-axis. Potassium (K) is excluded as it was not reported in the literature. The open squares and downward triangles show a direct comparison of abundances measured from HARPS and MIKE spectra using the same spectral lines and analysis methods applied in this study. The differences reflect both instrumental systematics and manual measurement variability between HARPS and MIKE.
Current usage metrics show cumulative count of Article Views (full-text article views including HTML views, PDF and ePub downloads, according to the available data) and Abstracts Views on Vision4Press platform.
Data correspond to usage on the plateform after 2015. The current usage metrics is available 48-96 hours after online publication and is updated daily on week days.
Initial download of the metrics may take a while.