Fig. 2
Download original image
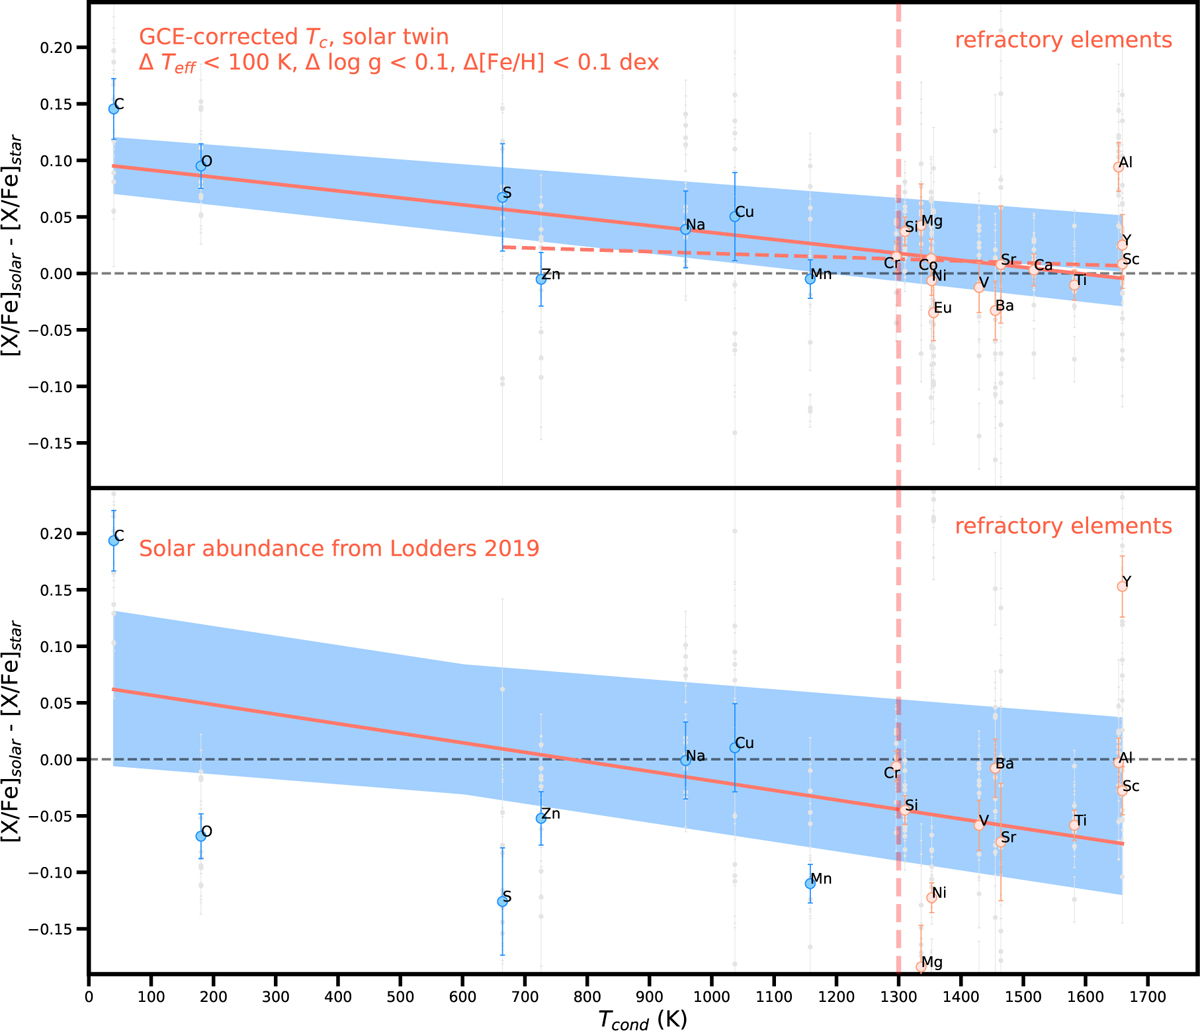
Upper panel: GCE-corrected differential abundances as a function of Tc for 11 solar twins from Papers I and II. Gray points mark individual stars selected with –0.1 < [Fe/H] < 0.1 dex, ΔTeff < 100 Κ, and Δ log ɡ < 0.1 dex. Colored symbols represent their mean elemental abundances in linear space: refractory elements (Tc > 1300 K) in orange, volatile elements in blue. The vertical dashed orange line indicates the Tc = 1300 Κ boundary. A weighted linear regression to the averaged data (including C and O) is shown as the solid orange line, with a shaded blue band denoting the 1σ confidence interval. The regression relation is ![]() . A fit excluding C and Ο is shown as the dashed orange line. Lower panel: same but using the solar abundances from Lodders (2019), which yields
. A fit excluding C and Ο is shown as the dashed orange line. Lower panel: same but using the solar abundances from Lodders (2019), which yields ![]() .
.
Current usage metrics show cumulative count of Article Views (full-text article views including HTML views, PDF and ePub downloads, according to the available data) and Abstracts Views on Vision4Press platform.
Data correspond to usage on the plateform after 2015. The current usage metrics is available 48-96 hours after online publication and is updated daily on week days.
Initial download of the metrics may take a while.