Open Access
Fig. C.1
Download original image
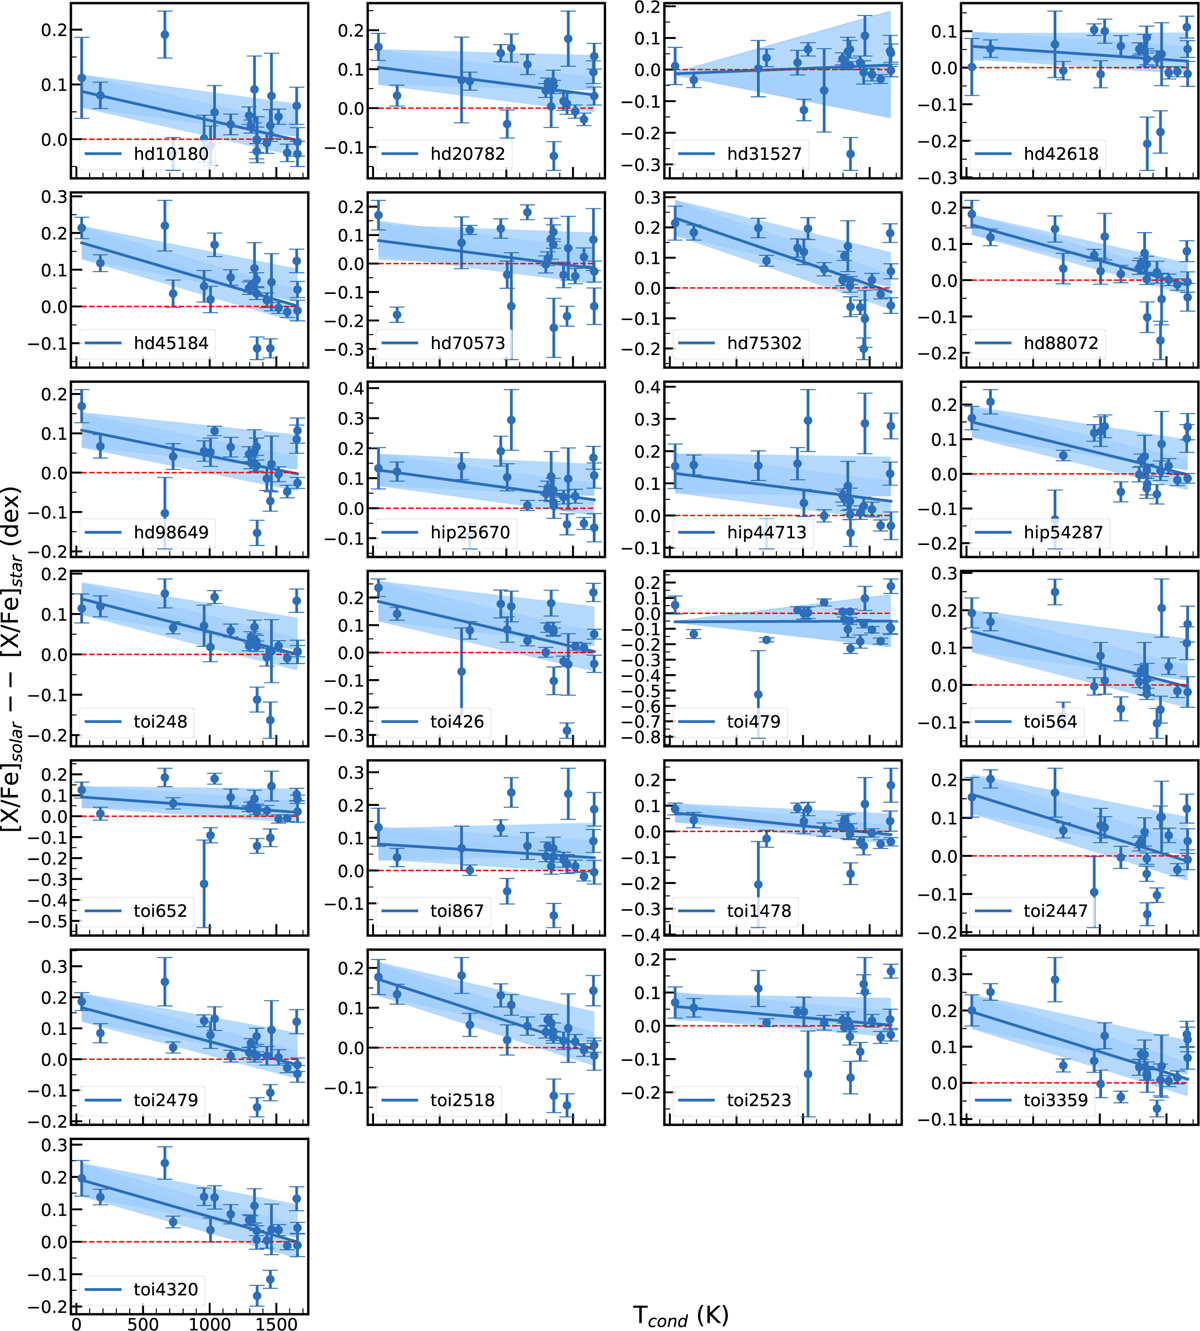
Trend of differential elemental abundance ([X/Fe]solar - [X/Fe]star) versus Tc. A linear fit to the blue symbols that include error bars is shown with a blue line. The background blue band displays the 1σ confidence interval. The Sun is located at a value and slope of 0, shown by the dashed red horizontal line.
Current usage metrics show cumulative count of Article Views (full-text article views including HTML views, PDF and ePub downloads, according to the available data) and Abstracts Views on Vision4Press platform.
Data correspond to usage on the plateform after 2015. The current usage metrics is available 48-96 hours after online publication and is updated daily on week days.
Initial download of the metrics may take a while.