Fig. 2.
Download original image
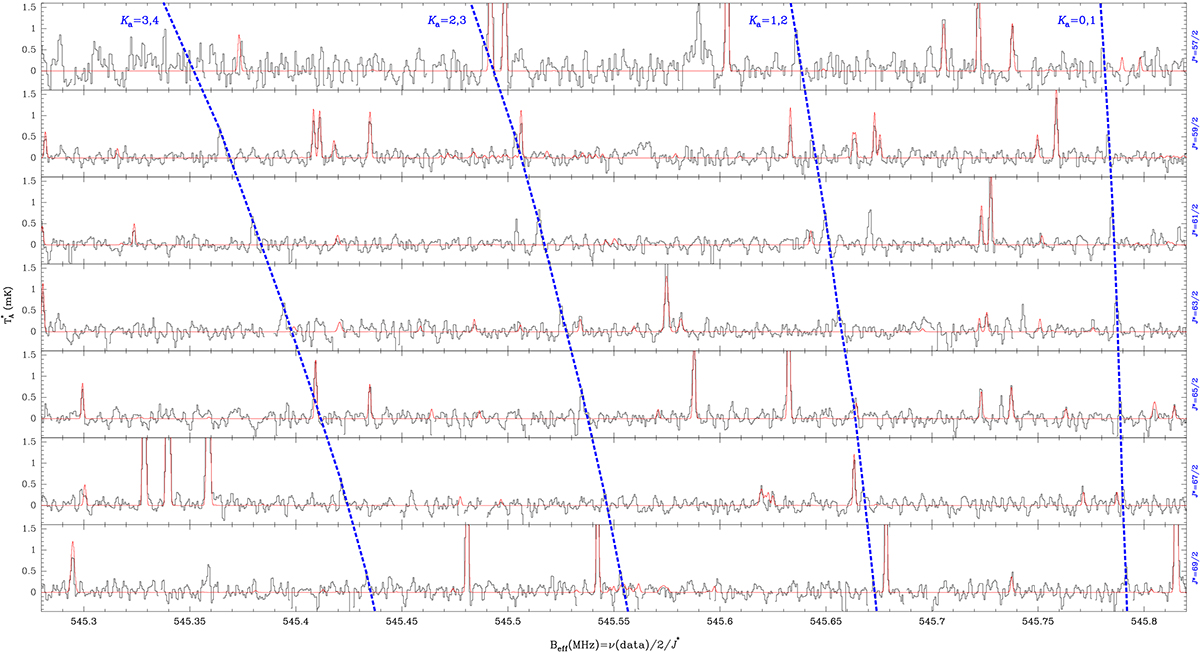
Modified Loomis-Wood diagram of some of the observed lines in this work. The abscissa corresponds to the value of the rotational constant, which has been fixed in this plot to values between 545.28 and 545.82 MHz. The ordinate is the antenna temperature (corrected for atmospheric and telescope losses) in millikelvin. Each box presents the QUIJOTE data for frequencies 2 BrotJ*, where J* = Ju + 1/2. The red line corresponds to the synthetic spectrum computed for TMC-1, including the rotational transitions of all molecular species detected in TMC-1. This spectrum does not contain the rotational lines discovered in this work. The rotational transitions of phenalene correspond to those connected through dashed blue lines (see text).
Current usage metrics show cumulative count of Article Views (full-text article views including HTML views, PDF and ePub downloads, according to the available data) and Abstracts Views on Vision4Press platform.
Data correspond to usage on the plateform after 2015. The current usage metrics is available 48-96 hours after online publication and is updated daily on week days.
Initial download of the metrics may take a while.