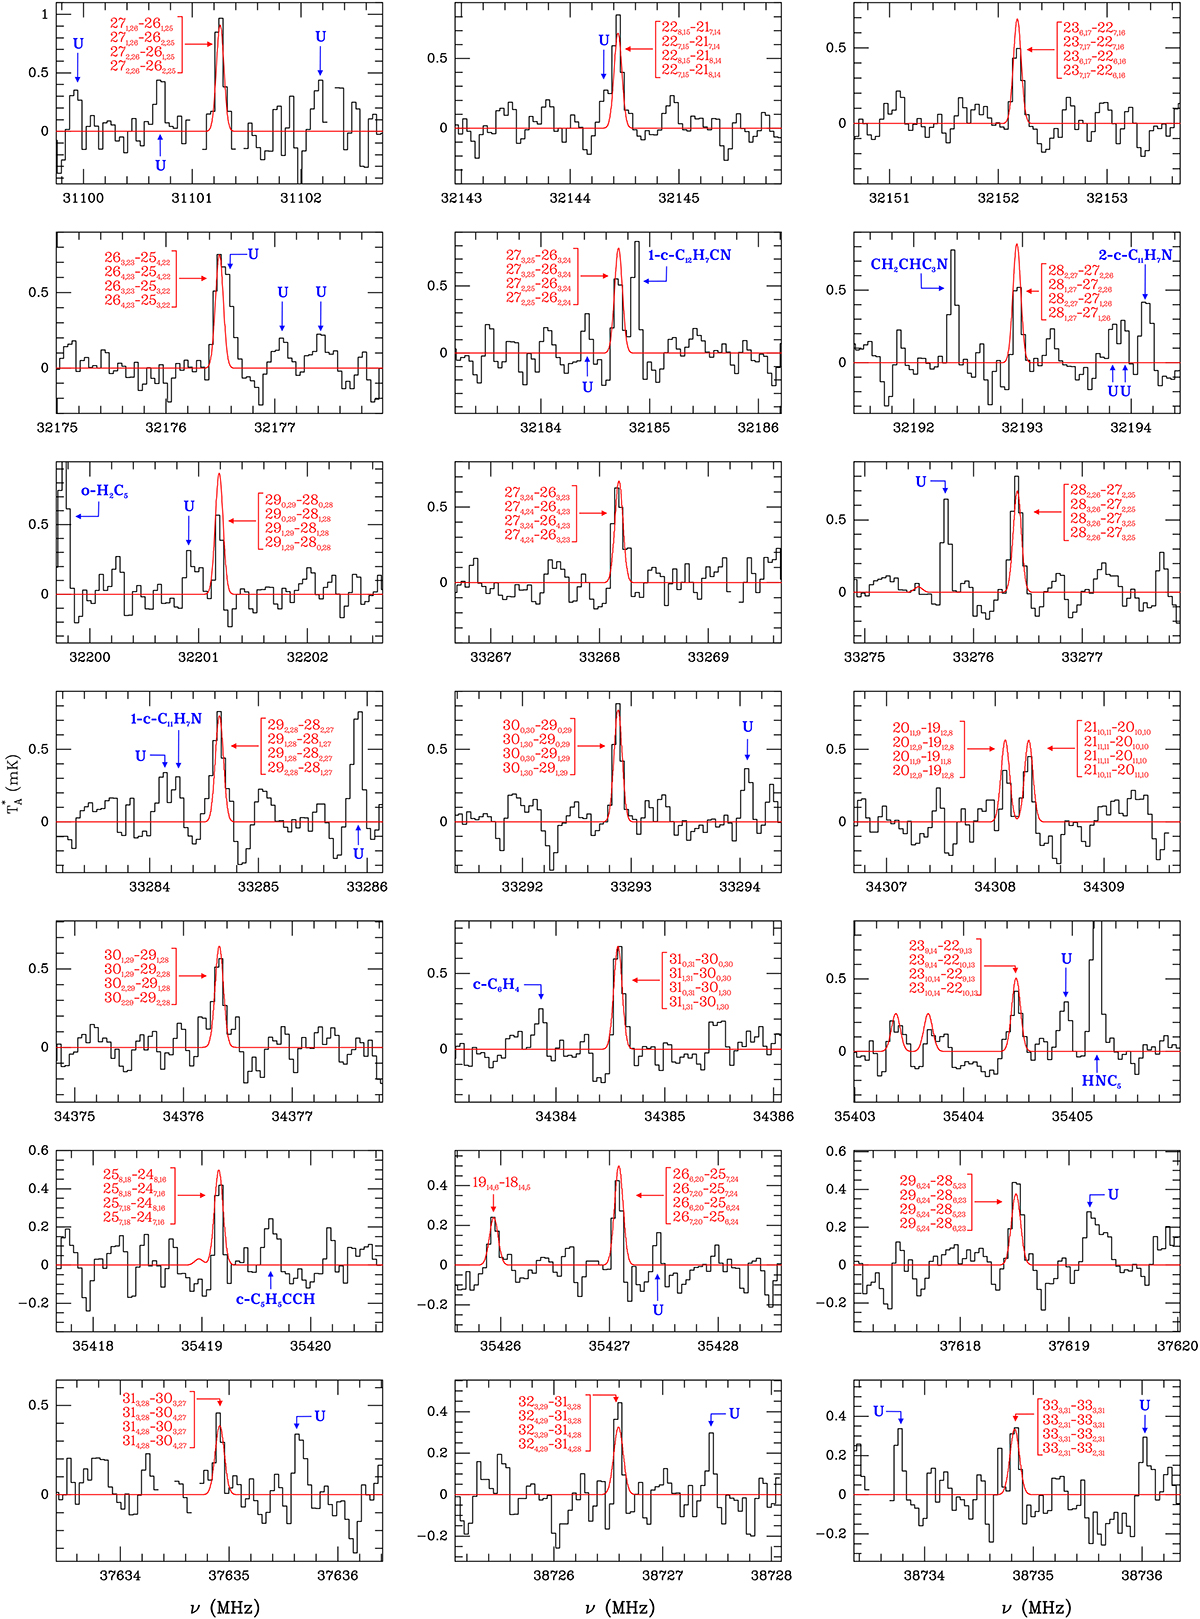
Fig. A.1.
Download original image
Selection of observed lines of phenalene in TMC-1 from the QUIJOTE line survey (black histogram) and synthetic spectra (red curve) calculated adopting a column density of 2.8×1013 cm−2. Blanked channels correspond to negative features produced in the folding of the frequency switching data. The lines are indicated by arrows and their quantum numbers are depicted for each feature. Other lines from molecules previously studied or unknown features are indicated in blue. The abscissa corresponds to the rest frequency assuming a local standard of rest velocity of 5.83 km s−1. The ordinate is the antenna temperature in millikelvin.
Current usage metrics show cumulative count of Article Views (full-text article views including HTML views, PDF and ePub downloads, according to the available data) and Abstracts Views on Vision4Press platform.
Data correspond to usage on the plateform after 2015. The current usage metrics is available 48-96 hours after online publication and is updated daily on week days.
Initial download of the metrics may take a while.