Open Access
Fig. C.1.
Download original image
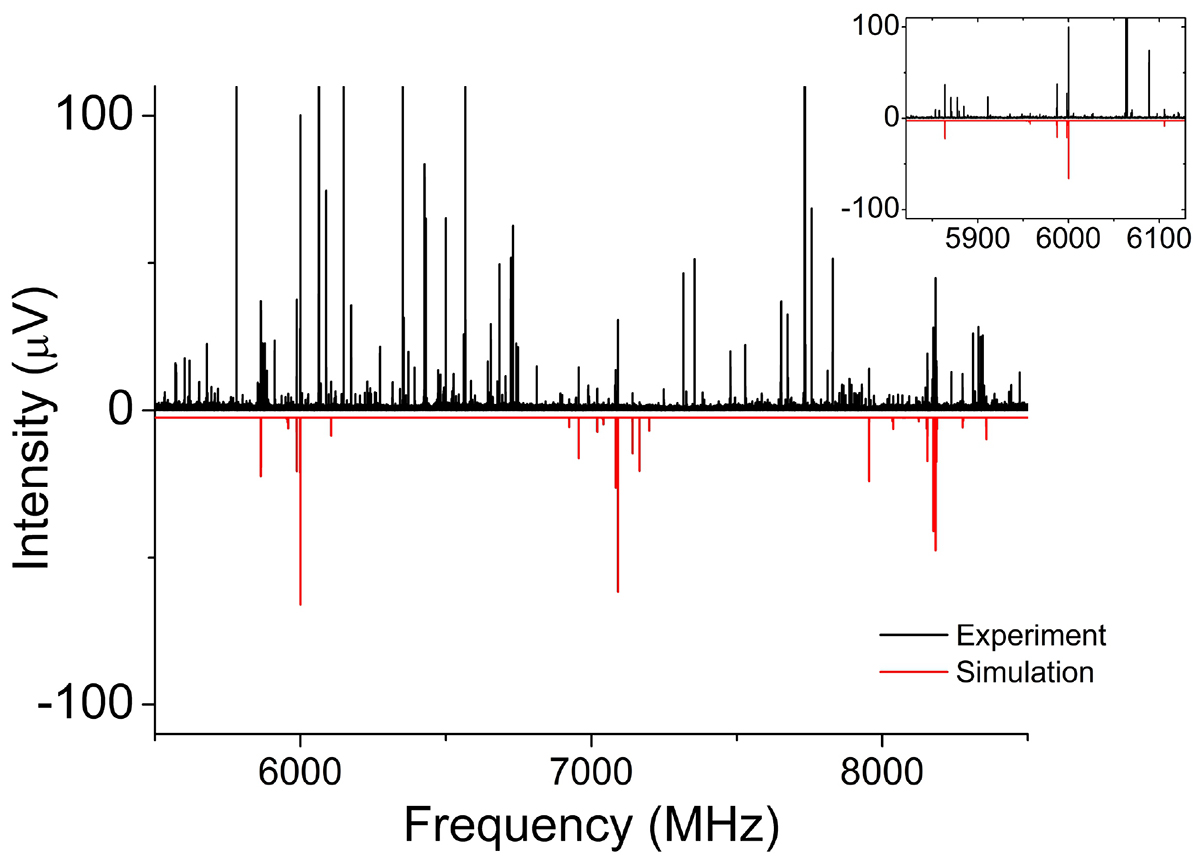
Inset of the recorded spectrum arising from gas-phase phenalene. The upper trace is the experimental spectrum, and the red trace is the simulated spectrum derived from the fitted rotational parameters at 1 K for phenalene.
Current usage metrics show cumulative count of Article Views (full-text article views including HTML views, PDF and ePub downloads, according to the available data) and Abstracts Views on Vision4Press platform.
Data correspond to usage on the plateform after 2015. The current usage metrics is available 48-96 hours after online publication and is updated daily on week days.
Initial download of the metrics may take a while.